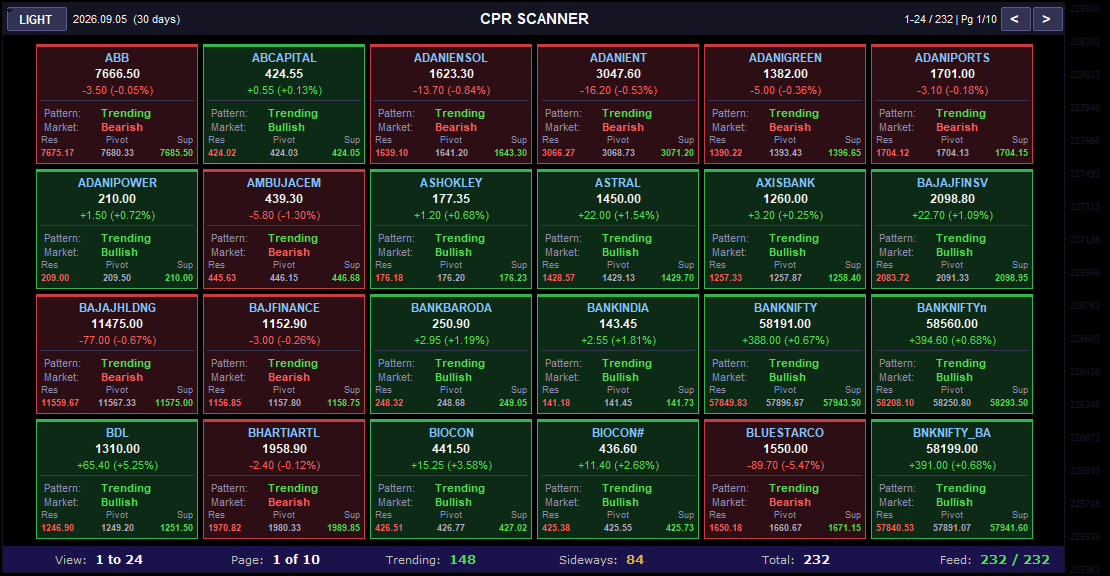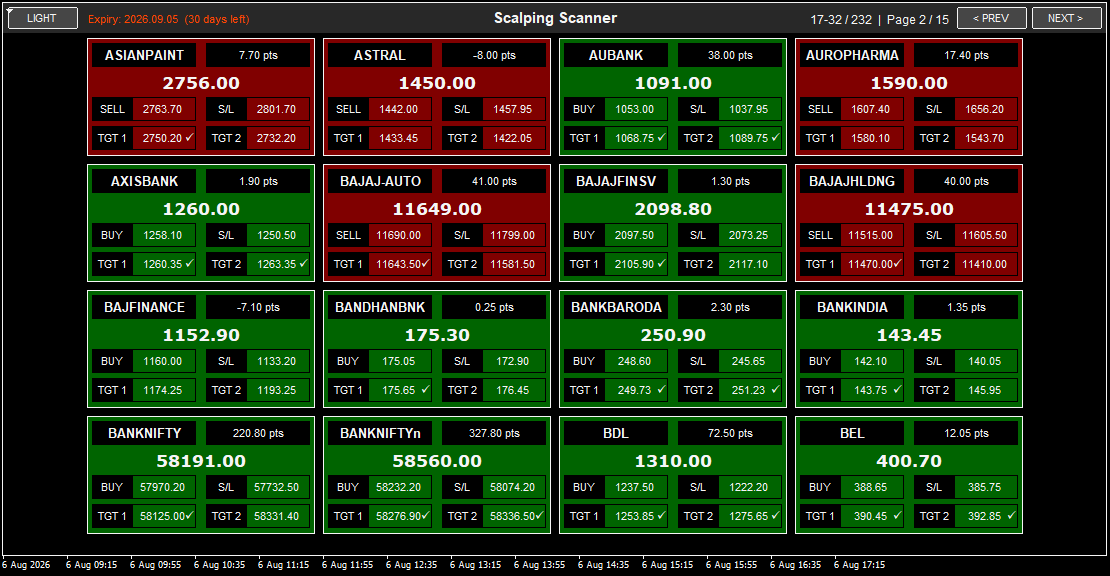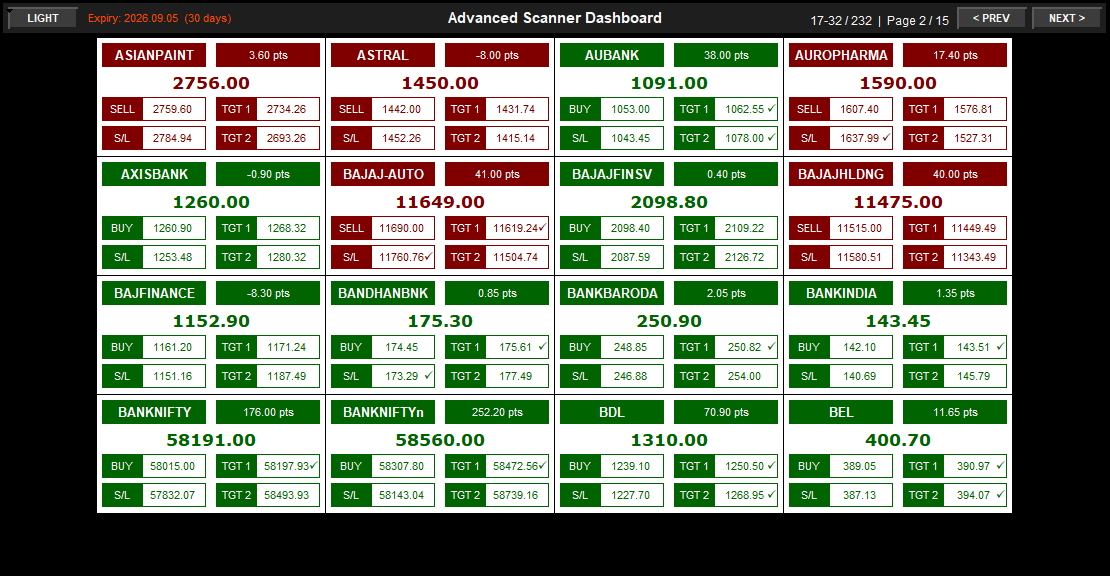

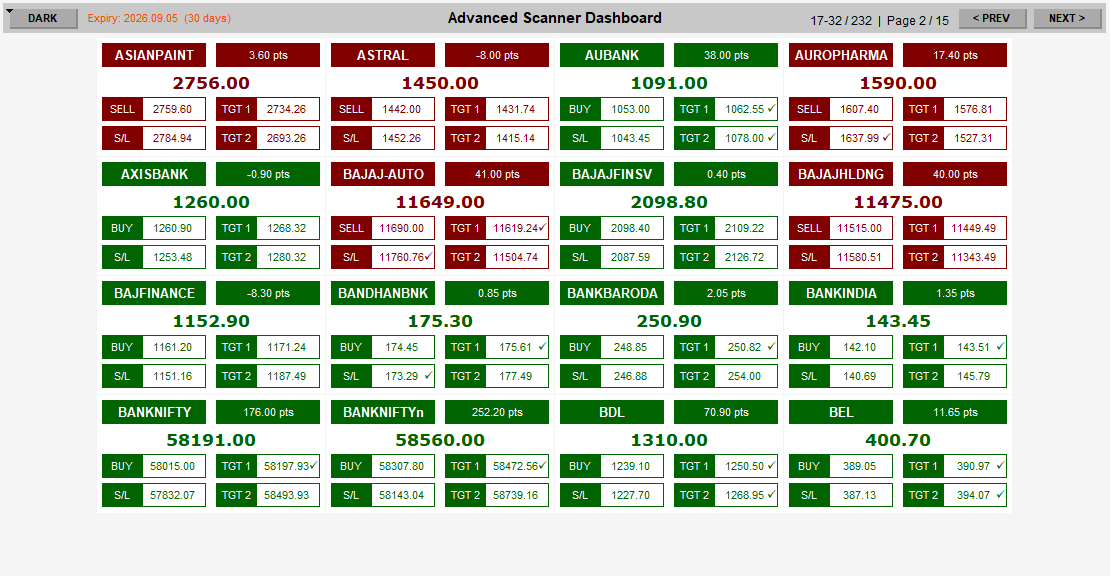
Transform your trading workspace into a powerful command center with Advanced MT4 Data Feed Scanner-the ultimate multi-symbol dashboard that displays up to 232+ trading opportunities across paginated screens. Instead of manually switching between charts to find signals, Advanced Scanner automatically scans all symbols in your MT4 watchlist and presents them in an organized 16-card grid layout with complete trade setups (BUY/SELL, Entry, TGT 1, TGT 2, Stop Loss) for each instrument. Each symbol card shows the current price, points change (positive/negative), and target achievement status (- checkmarks). Navigate through pages using PREV/NEXT buttons to explore all available signals, monitor 200+ instruments simultaneously, and identify the best trading opportunities within seconds. Click any symbol card to instantly open a full chart view with the integrated Market Rider indicator for detailed analysis. Perfect for active day traders and scalpers who need to monitor multiple positions, scan for fresh signals across sectors, and maximize profit opportunities without wasting time on manual chart switching. Features Light/Dark theme toggle, expiry tracking for derivatives, color-coded cards (green for BUY signals, red for SELL signals), and real-time points movement display. Whether you trade indices, stocks, forex, or commodities, Advanced Scanner is your mission control dashboard for systematic multi-symbol trading.
Advanced Scanner revolutionizes how traders monitor markets by consolidating hundreds of trading signals into a single, organized dashboard. Instead of opening 50+ charts individually or scrolling through endless watchlists, this indicator automatically scans every symbol in your MT4 watchlist and displays the current signal status in a clean, paginated grid layout.
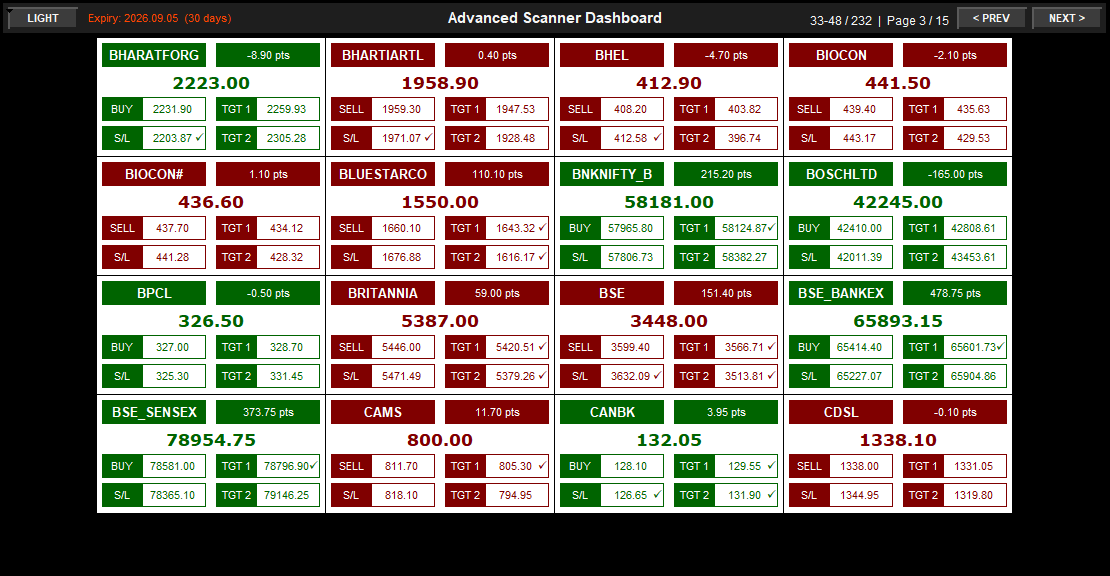
The works with MT4 Data Feed across Multi-Symbol Dashboard shows 16 symbols per page in an organized 4x4 grid, with each card containing complete trade information: signal type (BUY or SELL), entry price, dual targets (TGT 1 and TGT 2), stop loss, current market price, and points change since signal generation. Color-coded headers instantly communicate market direction-green headers for BUY signals and positive point movements, red headers for SELL signals and negative point movements. The large central price display keeps you updated on current market levels at a glance.
The Pagination System is the game-changer for traders monitoring large watchlists. If you have 232 symbols in your watchlist (as shown in the example), Advanced Scanner organizes them across 15 pages. The top bar displays "17-32 / 232 | Page 2 / 15," showing you're viewing symbols 17-32 of 232 total signals on page 2. Use the PREV and NEXT buttons to navigate through pages-each click reveals 16 new trading opportunities. This eliminates the chaos of managing dozens of open chart windows or manually clicking through symbols one by one.
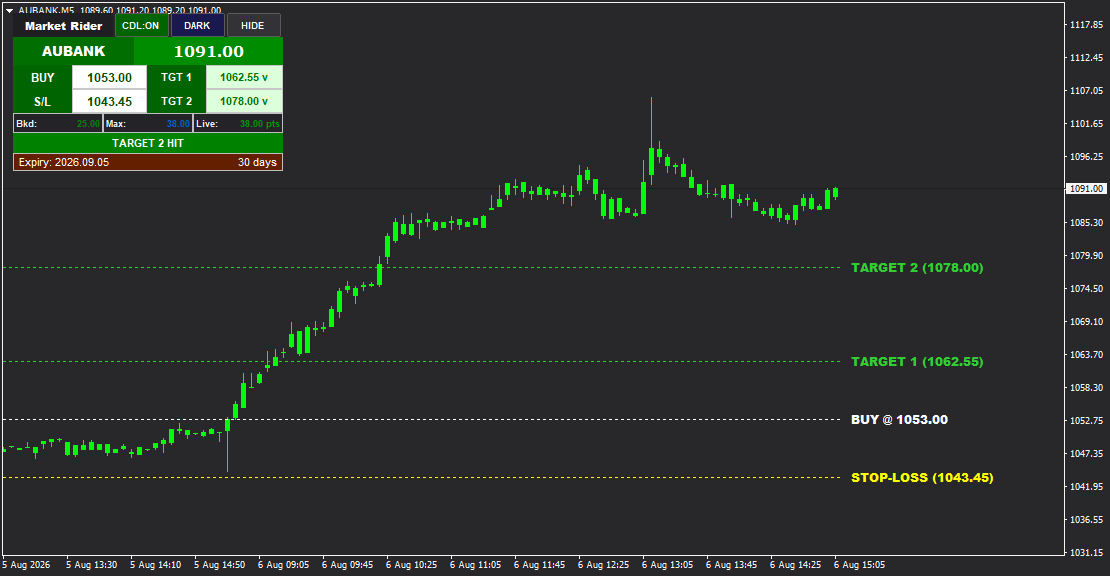
The Clickable Symbol Cards feature seamlessly integrates with your existing workflow. When you spot an interesting opportunity on the dashboard-say, AUBANK showing a BUY signal with positive momentum-simply click the AUBANK card. Advanced Scanner instantly opens a full chart view with the Market Rider indicator (or your preferred indicator) loaded, showing detailed price action, entry markers, target lines, stop loss levels, and performance tracking. Analyze the setup, execute the trade, then return to the dashboard to scan for the next opportunity.
Each symbol card displays Target Achievement Indicators using checkmarks (-). When TGT 1 is achieved, a green checkmark appears next to the target value. When TGT 2 is achieved, another checkmark confirms full profit realization. This visual feedback helps you quickly identify which trades are performing, which targets have been hit, and which positions need monitoring. The Points Change Display (e.g., "+38.00 pts" or "-8.00 pts") shows how many points the symbol has moved since the signal was generated, helping you assess momentum and urgency.
The Light/Dark Theme toggle adapts the dashboard to your preference-use Light mode for daytime trading or presentations, Dark mode for reduced eye strain during extended sessions. The Expiry Tracker at the top ("Expiry: 2026.09.05 | 30 days") monitors contract expiration for options and futures traders, ensuring you avoid last-week positions prone to rapid theta decay.
Advanced Scanner is purpose-built for traders who want to maximize market coverage without information overload. By scanning your entire watchlist (50, 100, 200+ symbols) and presenting only the essential trade data in a clean interface, you can identify 5-10 high-probability setups in under 60 seconds-something that would take 30+ minutes with manual chart switching. Whether you're monitoring a sector (banking stocks), an index family (NIFTY, BANKNIFTY, SENSEX), or a diversified portfolio (stocks, commodities, forex), Advanced Scanner is your mission control for systematic, efficient, multi-symbol trading.
---
## FEATURE HIGHLIGHTS
- Multi-Symbol Dashboard - Displays 16 symbols per page in organized 4x4 grid layout
- Pagination System - Navigate through multiple pages (e.g., Page 2 / 15) to view all signals
- Massive Watchlist Support - Scan and display 200+ symbols (232 shown in example)
- Symbol Counter - Shows current range (e.g., "17-32 / 232") so you always know your position
- PREV / NEXT Navigation - Quick page switching buttons for seamless browsing
- Clickable Symbol Cards - Click any card to open full chart view with integrated indicator
- Complete Trade Setups - Each card shows BUY/SELL, Entry, TGT 1, TGT 2, Stop Loss
- Current Price Display - Large prominent price for each symbol in real-time
- Points Change Tracker - Shows pts movement (positive or negative) since signal generation
- Color-Coded Headers - Green for BUY signals/positive moves, Red for SELL signals/negative moves
- Target Achievement Indicators - Checkmarks (-) appear when TGT 1 or TGT 2 is achieved
- Light/Dark Theme Toggle - Switch between light and dark backgrounds for optimal viewing
- Expiry Tracker - Displays contract expiration date and days remaining (derivatives)
- Watchlist Integration - Automatically scans all symbols added to your MT4 watchlist
- Real-Time Updates - Dashboard refreshes continuously to show latest signals and prices
- Market Rider Integration - Clicking a symbol opens chart with Market Rider indicator loaded
- Visual Clarity - Clean, organized layout eliminates information clutter
- Sector Scanning - Monitor entire sectors (banking, pharma, IT) on one screen
- Multi-Market Coverage - Works for indices, stocks, forex, commodities, options, futures
- Time-Saving Tool - Find 5-10 opportunities in seconds (vs. 30+ minutes manual scanning)
- One-Screen Solution - Eliminate 50+ open chart windows, manage everything from dashboard
- Mission Control Trading - Professional-grade overview for active traders and scalpers
---
## RECOMMENDED APPROACH
Initial Setup:
1. Add all symbols you want to monitor to your MT4 Market Watch window (indices, stocks, forex, commodities)
2. Attach Advanced Scanner indicator to any chart-it will automatically scan your entire watchlist
3. The dashboard appears showing 16 symbols per page with current signals
Using the Dashboard:
Page Navigation:
- Use NEXT > button to move forward through pages (Page 1 - 2 - 3, etc.)
- Use < PREV button to move backward through pages
- Check the Symbol Counter (e.g., "17-32 / 232") to see which symbols are currently displayed
- Check Page Indicator (e.g., "Page 2 / 15") to know your position in the full list
Scanning for Opportunities:
1. Start on Page 1 and scan the 16 symbol cards
2. Look for:
- Green headers with positive pts (strong BUY momentum)
- Red headers with negative pts (strong SELL momentum)
- Checkmarks (-) next to targets (trades performing well)
- Large price movements (high pts values = strong trends)
3. Click NEXT to view Page 2, scan 16 more symbols
4. Repeat until you've identified 3-5 high-probability setups
Opening Full Charts:
- When you find an interesting signal (e.g., AUBANK +38.00 pts with BUY), click the AUBANK card
- Advanced Scanner opens a full chart view with Market Rider indicator loaded
- Review entry markers, target lines, stop loss, and chart patterns
- If setup is valid, execute the trade in MT4
- Return to dashboard (or open a new chart instance) to continue scanning
Monitoring Active Positions:
- Use Advanced Scanner to monitor your open trades across multiple symbols
- Check for checkmarks (-) indicating target achievements
- Look for points change to gauge profit/loss since entry
- Click symbol cards to view detailed chart updates for positions needing attention
Trade Selection Criteria:
High-Priority Signals (Trade First):
- - Large positive pts for BUY signals (e.g., +38.00 pts, +176.00 pts) = strong momentum
- - Large negative pts for SELL signals (e.g., -165.00 pts, -151.40 pts) = strong downtrend
- - Checkmarks (-) already visible = signal is working, consider entering on pullback
- - Multiple targets hit = proven signal quality
Medium-Priority Signals (Review Carefully):
- Small positive/negative pts (e.g., +2.05 pts, -0.90 pts) = early signal or weak momentum
- No checkmarks yet = signal fresh, requires detailed chart review before entry
- Mixed signals across sector = check individual chart for confirmation
Low-Priority Signals (Skip or Monitor):
- Conflicting sector signals (e.g., 3 banking stocks BUY, 2 SELL) = unclear trend
- Very large stop loss relative to targets = poor risk-reward
- Expiry < 7 days for options = high theta decay risk
Theme Selection:
- Light Theme: Use during daytime trading or when presenting to others
- Dark Theme: Use for extended trading sessions to reduce eye strain
Expiry Management (Derivatives Traders):
- Check Expiry Tracker at top: "Expiry: 2026.09.05 | 30 days"
- For options/futures with < 7 days remaining, avoid new positions (rapid theta decay)
- For positions with < 3 days remaining, consider early exit even if targets not hit
Recommended Workflows:
Workflow 1: Morning Market Scan (Find Best Opportunities)
1. Open Advanced Scanner at market open (9:15 AM)
2. Scan Page 1 (16 symbols) - identify 2-3 strong signals
3. Click NEXT - Scan Page 2 (16 symbols) - identify 2-3 strong signals
4. Click NEXT - Scan Page 3 (16 symbols) - identify 2-3 strong signals
5. Total time: 3-5 minutes to scan 48 symbols and identify 6-9 candidates
6. Click through top 3-5 candidates to view full charts and execute best 2-3 trades
7. Total time to find and execute 2-3 trades: 10-15 minutes (vs. 45+ minutes manually)
Workflow 2: Intraday Position Monitoring
1. Execute 5-10 trades across different symbols in the morning
2. Every 30-60 minutes, open Advanced Scanner dashboard
3. Navigate to pages containing your active positions
4. Check for checkmarks (-) indicating target achievements
5. Check points change to see which trades are profitable vs. struggling
6. Click cards for positions near targets to view full chart and decide on exits
7. Total time to monitor 10 positions: 2-3 minutes (vs. 15-20 minutes manually)
Workflow 3: Sector Rotation Analysis
1. Add all banking stocks to watchlist (AXISBANK, BAJAJFINANCE, BANKNIFTY, HDFCBANK, ICICIBANK, etc.)
2. Open Advanced Scanner - Navigate to pages showing banking stocks
3. Count BUY signals vs. SELL signals
4. If 70%+ show BUY with positive pts - strong sector bullishness, focus on BUY trades
5. If 70%+ show SELL with negative pts - strong sector bearishness, focus on SELL trades
6. If signals mixed 50/50 - sector in consolidation, avoid or use smaller position sizes
7. Repeat for other sectors (pharma, IT, auto, energy) to find strongest trending sector
Workflow 4: End-of-Day Review
1. 30 minutes before market close, open Advanced Scanner
2. Navigate through all pages to review all signals generated during the day
3. Identify symbols with checkmarks (--) on both targets = strong performers, add to watchlist for tomorrow
4. Identify symbols with no checkmarks and negative pts = weak signals, remove from watchlist
5. Plan tomorrow's watchlist based on today's performance patterns
DASHBOARD ANATOMY GUIDE
Top Bar Elements:
Left Side:
- LIGHT / DARK Toggle: Click to switch between light background (white/gray) and dark background (black/dark gray)
- Current selection highlighted in orange/red
Center:
- Title: "Advanced Scanner Dashboard" in bold
- Symbol Counter: "17-32 / 232" indicates you're viewing symbols #17 through #32 out of 232 total
- Page Indicator: "Page 2 / 15" shows current page number and total pages
Right Side:
- < PREV Button: Click to go to previous page (Page 2 - Page 1)
- NEXT > Button: Click to go to next page (Page 2 - Page 3)
- Expiry Tracker: "Expiry: 2026.09.05 (30 days)" shows contract expiration for derivatives (options/futures)
Symbol Card Anatomy:
Each card contains 7-8 key elements:
1. Header Bar (Top):
- Symbol Name: e.g., "ASIANPAINT", "AUBANK", "BANKNIFTY" in bold white text
- Points Change: e.g., "+38.00 pts", "-8.00 pts" shows price movement since signal
- Color: Green header = BUY signal/positive movement, Red header = SELL signal/negative movement
2. Current Price (Center):
- Large bold number showing real-time market powered by MT4 Data Feed price (e.g., "1091.00", "58191.00")
- Most prominent element on card for quick price scanning
3. Signal Type (Left Column):
- BUY (Green): Long signal active
- SELL (Red): Short signal active
- Button format for visual clarity
4. Entry Price (Left Column, Row 2):
- Entry price for the signal (e.g., "1053.00", "58015.00")
- Preceded by "BUY" or "SELL" label
5. Stop Loss (Left Column, Row 3):
- S/L: Stop loss price (e.g., "1043.45", "57832.07")
- Critical risk management level
6. Target 1 (Right Column, Row 2):
- TGT 1: First target price (e.g., "1062.55 -", "58197.93-")
- Checkmark (-) appears when target is achieved
7. Target 2 (Right Column, Row 3):
- TGT 2: Second target price (e.g., "1078.00 -", "58493.93")
- Checkmark (-) appears when target is achieved
Card Color Coding:
- Green Header Cards: BUY signals with positive points movement
- Example: AUBANK (+38.00 pts), BAJAJFINSV (+0.40 pts)
- Indicates bullish momentum, upward price movement
- Red Header Cards: SELL signals with negative points movement
- Example: ASIANPAINT (-3.60 pts), ASTRAL (-8.00 pts), BAJAJ-AUTO (+41.00 pts for SELL = price declining)
- Indicates bearish momentum, downward price movement
Grid Layout:
- 4 Columns x 4 Rows = 16 Symbols per Page
- Organized alphabetically or by watchlist order
- Evenly spaced for visual clarity and easy scanning
Bottom Area:
- Empty space for clean design, no clutter
CLICKABLE CARD INTEGRATION GUIDE
How Card Clicking Works:
When you click any symbol card on the Advanced Scanner dashboard, the system automatically:
1. Opens a new chart window (or switches to existing chart) for that symbol
2. Loads the Market Rider indicator with pre-configured settings
3. Displays complete trade setup with visual elements:
- Entry marker on chart (red X for BUY, red arrow for SELL)
- Horizontal target lines (TGT 1 and TGT 2) with labels
- Horizontal stop loss line with label
- Trailing Stop Loss line (if applicable)
- Checkmarks (-) on chart when targets are achieved
- Dashboard showing BUY/SELL, Entry, Targets, SL, Live P&L, Booked P&L
Example Workflow:
Scenario: Finding and Executing a BUY Trade
1. Dashboard View (Screenshot 1):
- You see AUBANK card: Green header, +38.00 pts, Current Price 1091.00
- Card shows: BUY 1053.00, TGT 1 1062.55 -, TGT 2 1078.00 -, S/L 1043.45
- Both targets have checkmarks-signal is working well!
- You want to review the chart to see if there's a retracement entry opportunity
2. Click AUBANK Card:
- System opens AUBANK chart with Market Rider indicator loaded (Screenshot 4)
3. Full Chart View (Screenshot 4):
- Chart shows complete price history with BUY entry marker
- Horizontal lines labeled: "BUY @ 1053.00", "TARGET 1 (1062.55)", "TARGET 2 (1078.00)", "STOP-LOSS (1043.45)"
- Dashboard at top-left shows:
- "AUBANK 1091.00"
- "BUY 1053.00, TGT 1 1062.55 -, TGT 2 1078.00 -, S/L 1043.45"
- "TARGET 2 HIT" status in green
- "Bkd: -, Max: -, Live: -" tracking fields
- COL:ON, DARK, HIDE buttons for display customization
- Expiry tracker: "Expiry: 2026.09.05 | 30 days"
- You can see price is currently at 1091.00, well above both targets
- Decision: Signal already achieved both targets; wait for pullback to 1070-1075 for re-entry
4. Return to Dashboard:
- Close chart or keep it open in background
- Return to Advanced Scanner dashboard
- Click NEXT to scan more opportunities on Page 3
Scenario: Finding and Executing a SELL Trade
1. Dashboard View (Screenshot 3):
- You see BLUESTARCO card: Red header, +110.10 pts (SELL signal, so +110 pts = price declined 110 pts)
- Card shows: SELL 1660.10, TGT 1 1643.32 -, TGT 2 1616.17 -, S/L 1676.88
- Both targets have checkmarks-strong signal!
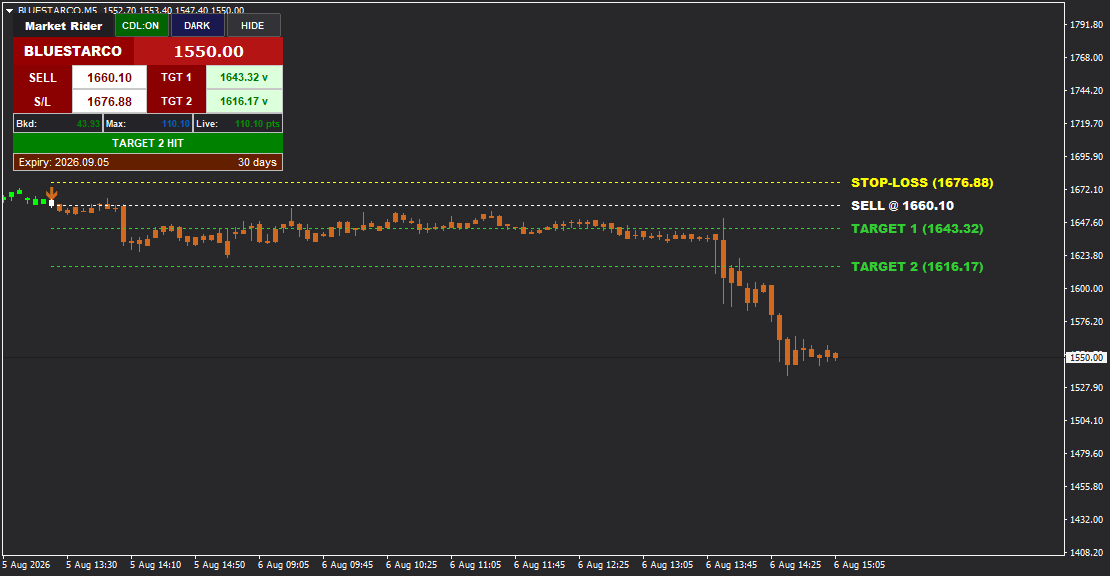
2. Click BLUESTARCO Card:
- System opens BLUESTARCO chart with Market Rider indicator loaded (Screenshot 5)
3. Full Chart View (Screenshot 5):
- Chart shows bearish price action with SELL entry marker
- Horizontal lines labeled: "SELL @ 1660.10", "TARGET 1 (1643.32)", "TARGET 2 (1616.17)", "STOP-LOSS (1676.88)"
- Dashboard shows:
- "BLUESTARCO 1550.00"
- "SELL 1660.10, TGT 1 1643.32 -, TGT 2 1616.17 -, S/L 1676.88"
- "TARGET 2 HIT" status in green
- Price has dropped from 1660 to 1550 (110 points decline)
- Both targets achieved, signal fully successful
- Decision: Signal complete; look for next opportunity
Benefits of Card Integration:
- Instant Context Switching: Go from dashboard overview to detailed chart analysis in 1 click
- Pre-Loaded Indicators: Market Rider automatically loads with all settings configured
- Complete Visual Setup: All entry, target, and stop loss lines already plotted
- Performance Tracking: Live P&L and Booked P&L visible immediately
- No Manual Setup: No need to manually draw lines, set indicators, or configure displays
- Seamless Workflow: Dashboard - Chart - Trade - Dashboard - Repeat
Multi-Monitor Setup:
For professional traders with 2-3 monitors:
- Monitor 1: Advanced Scanner dashboard (full screen) for continuous scanning
- Monitor 2: 2-4 individual chart windows for active positions
- Monitor 3: MT4 terminal/trade execution panel
Click cards on Monitor 1 - Charts open on Monitor 2 - Execute trades on Monitor 3
---
## TECHNICAL SPECIFICATIONS
Indicator Type: Multi-symbol scanning dashboard with pagination and clickable cards
Scan Capacity: 200+ symbols (232+ shown in example)
Display Format: 16 symbols per page in 4x4 grid layout
Pagination: PREV/NEXT navigation with page counter (e.g., "Page 2 / 15")
Signal Types: BUY and SELL with dual targets
Card Elements: Symbol name, current price, points change, entry, TGT 1, TGT 2, stop loss
Color Coding: Green headers (BUY/positive), Red headers (SELL/negative)
Target Indicators: Checkmarks (-) for achieved targets
Theme Options: Light and Dark background toggle
Expiry Tracking: Contract expiration date and days remaining display
Integration: Clickable cards open full charts with Market Rider indicator
Watchlist Source: Automatically scans all symbols in MT4 Market Watch window
Real-Time Updates: Dashboard refreshes continuously with latest prices and signals
Visual Clarity: Clean, organized layout eliminating chart clutter
Navigation: Symbol counter showing current range (e.g., "17-32 / 232")
Market Coverage: Indices, stocks, forex, commodities, options, futures
Platform: MetaTrader 4 (MT4)