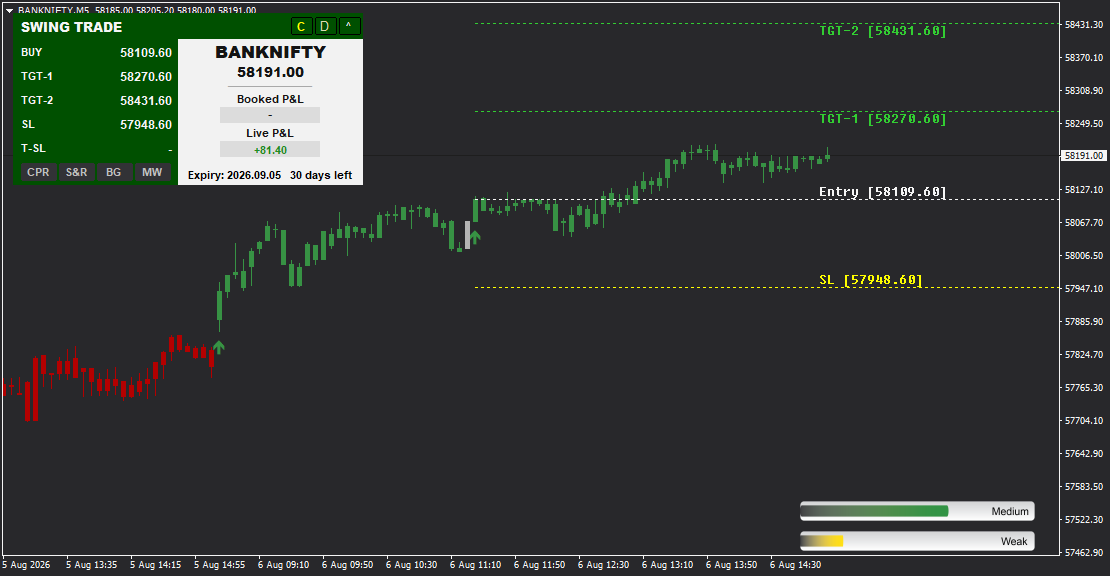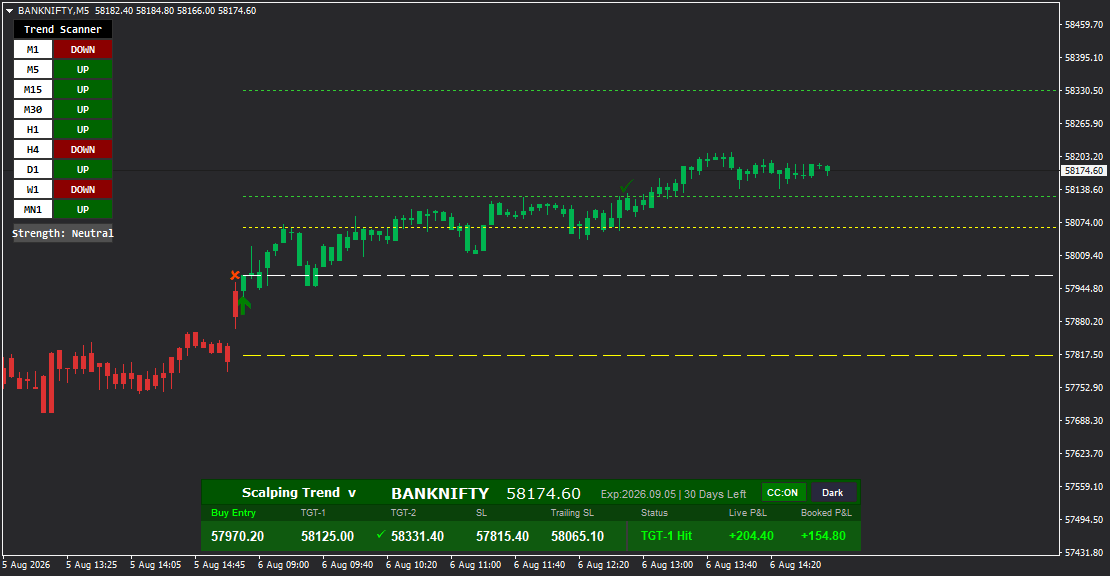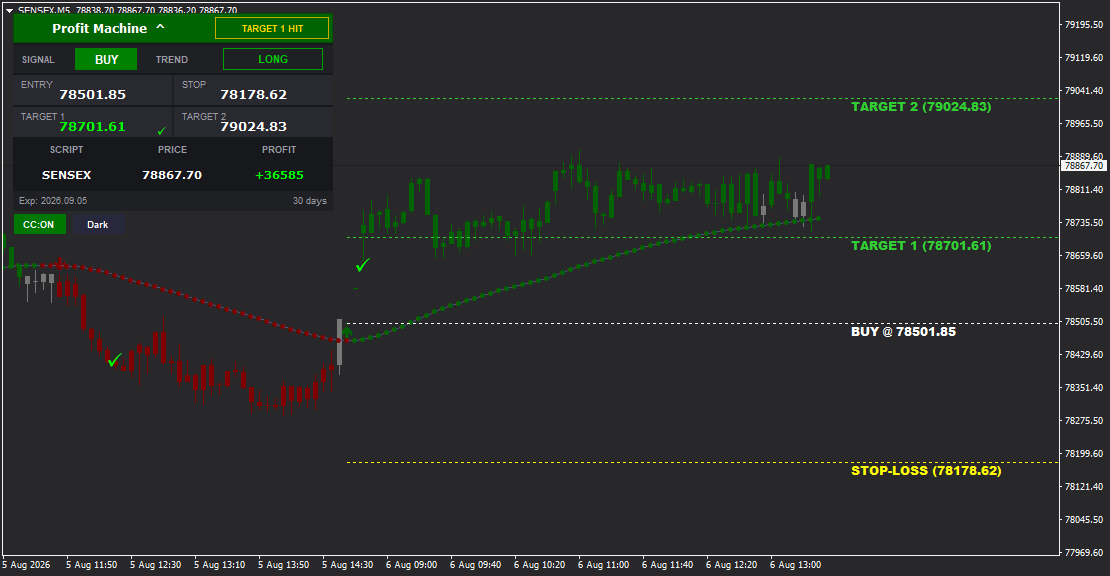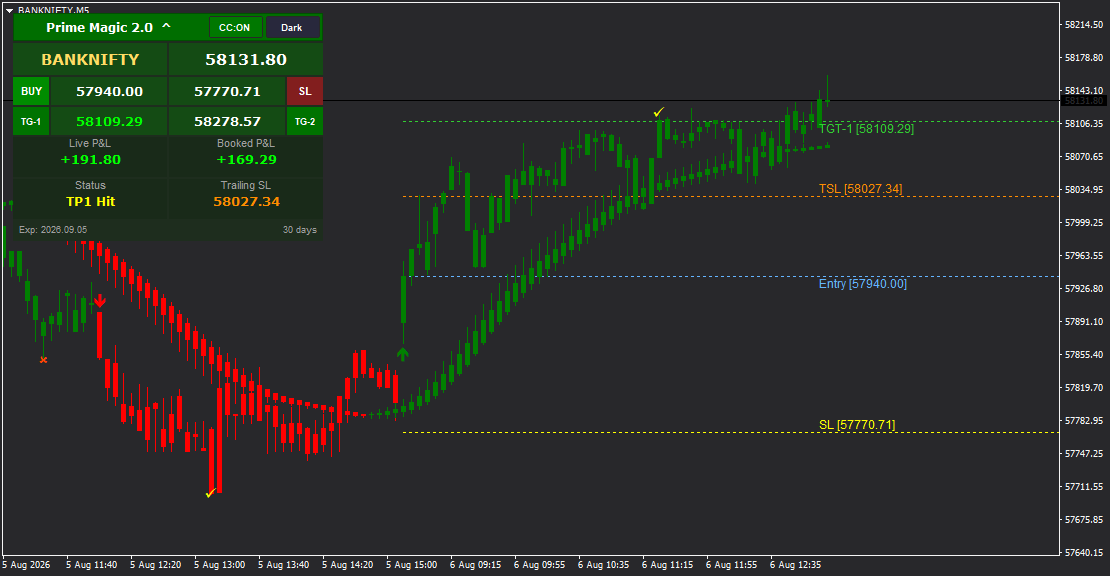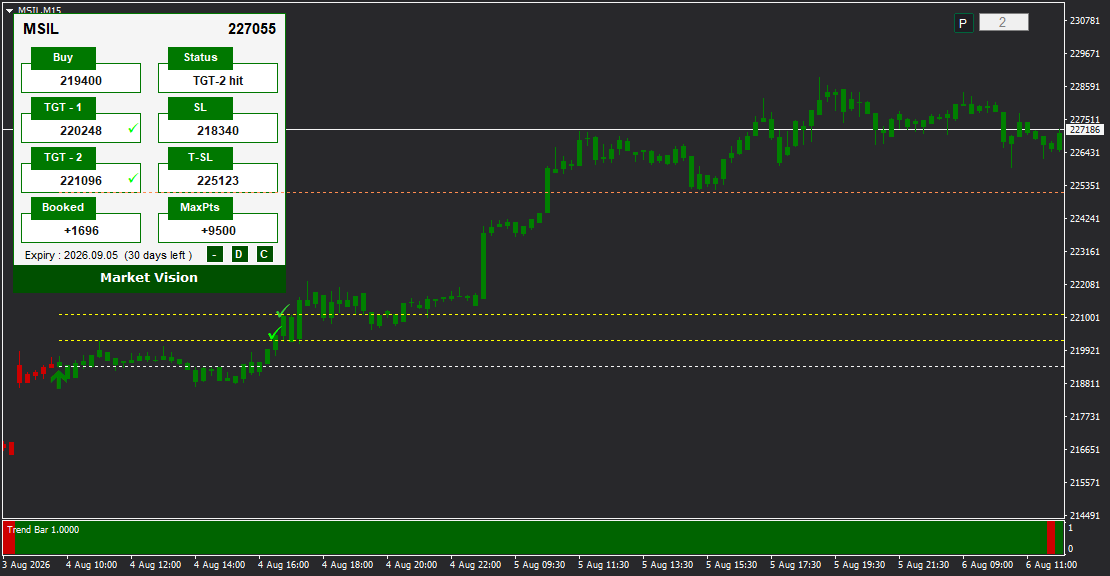

Market Vision is an advanced MT4 indicator combining precision signal generation with intelligent Trailing Stop Loss (T-SL) technology and a real-time MT4 Data Feed Trend Bar analyzer. It delivers clear BUY and SELL signals with Entry, Stop Loss, Target 1, Target 2, and an adaptive Trailing Stop Loss that locks in profits as trends develop. The built-in Trend Bar at the chart bottom provides instant visual trend strength feedback with color-coded bars, while checkmarks (-) confirm achieved targets in real time. Complete with Booked profits and MaxPts tracking, color-coded candles, Light/Dark theme support, and labeled on-chart price lines, Market Vision gives you both the vision to spot opportunities and the tools to maximize them.
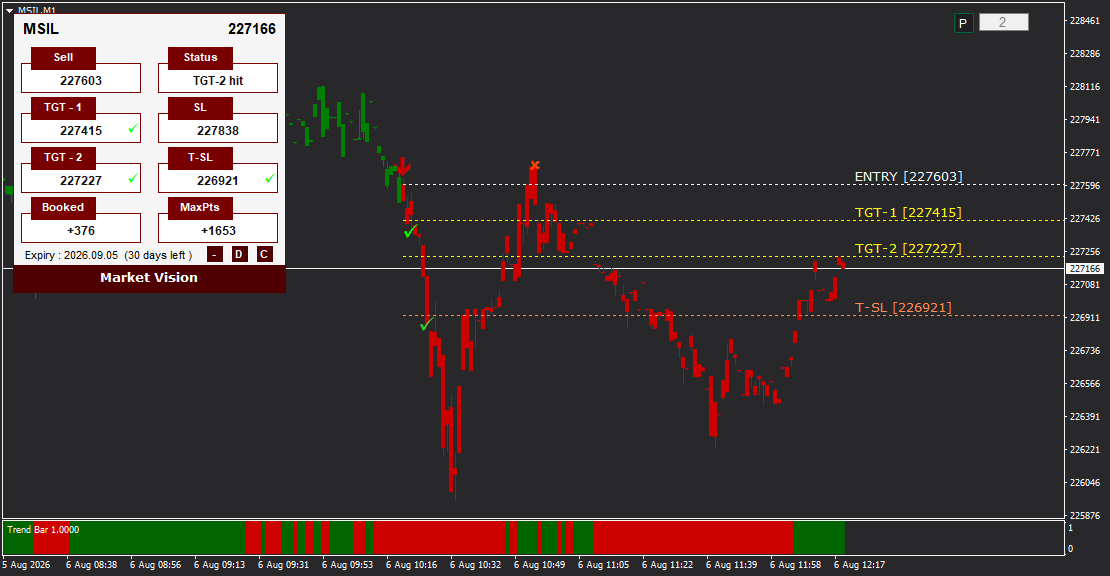
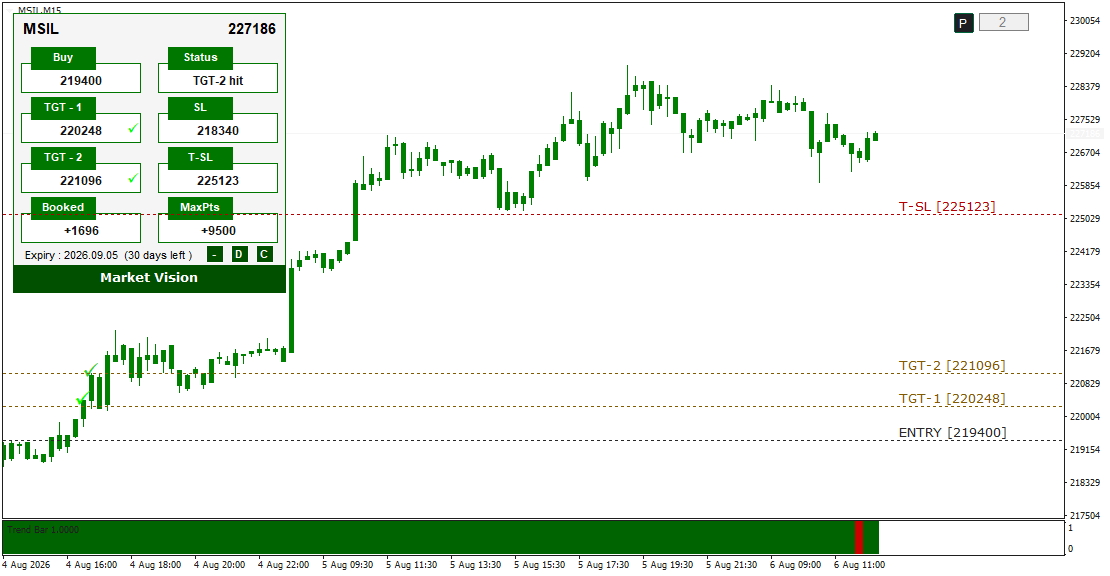
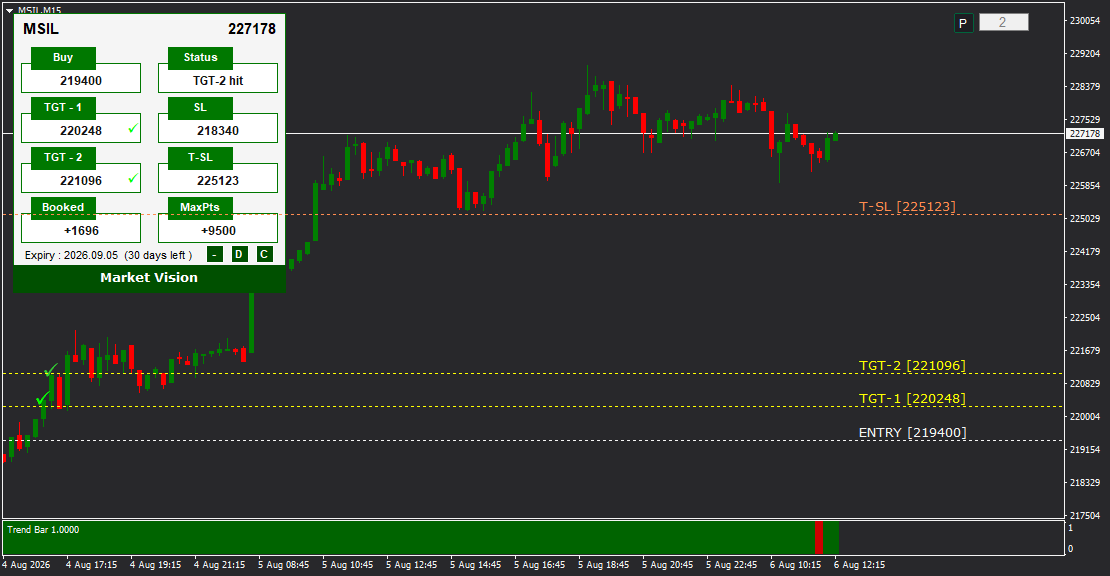
Market Vision - See Further, Trade Smarter with Trailing Stop Loss & Trend Bar Technology
Market Vision is a professional-grade MetaTrader 4 indicator designed for traders who want more than just entry signals - they want complete trade protection, profit maximization, and real-time trend intelligence. This leverages MT4 Data Feed for optimal performance. Market Vision combines precise BUY/SELL signal generation with two powerful features that set it apart: an adaptive Trailing Stop Loss (T-SL) system and a visual Trend Bar indicator.
Whether you're trading stocks, forex, commodities, or crypto, Market Vision provides all essential trade levels (Entry, SL, TGT 1, TGT 2) while automatically calculating an intelligent Trailing Stop Loss that moves with the trend to protect your gains. The Trend Bar at the bottom of your chart gives you instant visual confirmation of trend strength and direction with color-coded bars.
This is not just another signal indicator - Market Vision is a complete trading system with built-in profit protection and trend analysis.
Key Features
Trailing Stop Loss (T-SL) Technology
The standout feature of Market Vision is its intelligent Trailing Stop Loss system:
- Automatic T-SL Calculation - For every signal, Market Vision calculates an optimal Trailing Stop Loss level beyond your profit targets
- Profit Protection - As price moves in your favor, the T-SL level adjusts to lock in gains while giving the trend room to breathe
- Clearly Labeled on Chart - T-SL line displays as a labeled horizontal line (e.g., "T-SL [225123]", "T-SL [226921]")
- Visual Confirmation - When T-SL is hit, dashboard shows checkmark (-) next to the T-SL value
- Maximum Profit Security - Ensures you never give back large gains if the trend reverses
Example BUY Signal Flow:
- Entry: 219400
- Target 1: 220248 (first profit booking)
- Target 2: 221096 (second profit booking)
- T-SL: 225123 (trailing stop locks in all gains and captures extended moves)
The T-SL is positioned significantly beyond Target 2, allowing you to capture exceptional trend extensions while protecting all your earlier profits. If price reverses and hits T-SL, you exit with maximum gains secured.
Trend Bar Visual Analyzer
Market Vision includes a dedicated Trend Bar panel at the bottom of your chart:
- Color-Coded Bars - Green bars indicate bullish/uptrend periods, red bars indicate bearish/downtrend periods
- Real-Time Updates - Bars change color as trend strength shifts
- Instant Trend Confirmation - Glance at the Trend Bar to see current trend direction without analyzing chart patterns
- Ratio Display - Shows "Trend Bar 1:0000" with numerical trend measurement
- Visual Harmony - Works seamlessly with main chart signals
The Trend Bar gives you immediate visual feedback on trend health. When you receive a BUY signal and see predominantly green bars, you have strong trend confirmation. If bars start turning red during your trade, it signals potential trend weakness.
Complete Trade Setup with Dual Targets
Every Market Vision signal provides full trade information:
- Entry Price - Exact entry level (e.g., BUY 219400, SELL 227603)
- SL (Stop Loss) - Initial protective stop (e.g., 218340, 227838)
- TGT -1 (Target 1) - First profit target for partial booking (e.g., 220248, 227415)
- TGT -2 (Target 2) - Second profit target for additional booking (e.g., 221096, 227227)
- T-SL (Trailing Stop Loss) - Adaptive trailing stop for maximum profit capture (e.g., 225123, 226921)
Each target displays with a checkmark (-) when achieved, giving you instant visual confirmation of trade progress.
Performance Tracking System
Market Vision monitors your trading performance with two key metrics:
Booked:
- Shows realized profit/loss in points
- Updates when you close positions at targets or T-SL
- Example: "Booked: +1696" means you've locked in 1,696 points of profit
- Example: "Booked: +376" shows 376 points realized
MaxPts (Maximum Points):
- Shows the peak profit achieved since trade entry
- Tracks the best performance even if price has pulled back
- Example: "MaxPts: +9500" means trade reached 9,500 points profit at peak
- Example: "MaxPts: +1653" shows peak was 1,653 points
- Helps you understand optimal exit timing
This two-metric system shows both what you've realized (Booked) and what the trade's potential was (MaxPts), providing valuable performance insights.
Target Achievement Confirmation
Market Vision uses visual checkmarks (-) to show target completion:
- TGT -1 with - - Target 1 has been hit, book first partial
- TGT -2 with - - Target 2 has been hit, book second partial
- T-SL with - - Trailing stop loss hit, maximum profit secured
- Status Display - "TGT-2 hit" status message confirms completion
The checkmark system eliminates confusion about which levels have been achieved - you always know exactly where you stand.
Color-Coded Candle System
Market Vision features intelligent candle coloring:
- Green Candles - Displayed during bullish trends and BUY signal periods
- Red Candles - Displayed during bearish trends and SELL signal periods
- Full Chart Coloring - Entire trend section is color-coded for maximum visual clarity
- Trend Confirmation - Candle colors align with Trend Bar colors for reinforcement
The colored candle system creates visual harmony across your chart, making trend direction immediately obvious at any glance.
On-Chart Labeled Lines
All price levels are drawn as clearly labeled horizontal lines on your chart:
- ENTRY [price] - Entry price line (white/gray label)
- TGT-1 [price] - First target line (yellow/orange label)
- TGT-2 [price] - Second target line (yellow/orange label)
- T-SL [price] - Trailing stop loss line (red/orange label)
Labels are positioned for maximum readability without cluttering your chart. You can see all your key levels at a glance.
Dashboard Layout
The Market Vision dashboard is organized for instant information access:
Header:
- Symbol name (e.g., MSIL)
- Current live price (e.g., 227178, 227166)
- P and 2 buttons (likely for settings/pages)
Signal Panel (Color-Coded Background):
- Buy or Sell label with entry price (green background for BUY, red/maroon for SELL)
Targets & Stops Panel:
- TGT -1: First target with price and checkmark when hit
- TGT -2: Second target with price and checkmark when hit
- SL: Stop loss level
- T-SL: Trailing stop loss level with checkmark when hit
Status Panel:
- Trade status message (e.g., "TGT-2 hit") displayed prominently
Performance Panel:
- Booked: Realized profit in points
- MaxPts: Peak profit achieved
Footer:
- Expiry date with countdown (e.g., "Expiry: 2026.09.05 (30 days left)")
- Three control buttons (likely theme/display controls)
- "Market Vision" branding label (color changes with signal: green for BUY, red for SELL)
The color-coded "Market Vision" footer label provides delivers MT4 Data Feed-powered instant signal-type recognition even when viewing the dashboard peripherally.
Light/Dark Theme Support
Market Vision adapts to your preferred trading environment:
Dark Theme (Default):
- Black chart background
- Optimized for low-light environments and night trading
- Reduces eye strain during extended sessions
- Professional aesthetic
Light Theme:
- White/light chart background
- Perfect for bright offices and daylight trading
- Clean, modern appearance
- Ideal for presentations and screen sharing
Switch themes instantly without affecting signal generation or functionality.
How It Works
Signal Generation:
Market Vision analyzes price action, momentum, volume, and market structure to identify high-probability trading setups. When conditions align:
1. A BUY or SELL signal is generated
2. Entry price is calculated and displayed
3. Initial Stop Loss is set for risk protection
4. Target 1 and Target 2 are calculated for profit booking
5. Trailing Stop Loss is calculated to capture extended moves
6. All levels appear on chart as labeled lines
7. Dashboard updates with complete trade information
8. Trend Bar confirms trend direction with color-coded bars
Taking Trades:
For BUY Signals:
1. Wait for BUY signal (green dashboard background)
2. Check Trend Bar - look for green bars confirming uptrend
3. Enter at displayed entry price
4. Set stop loss at SL level
5. Set profit targets at TGT -1 and TGT -2
6. Note the T-SL level for trailing stop management
For SELL Signals:
1. Wait for SELL signal (red dashboard background)
2. Check Trend Bar - look for red bars confirming downtrend
3. Enter at displayed entry price
4. Set stop loss at SL level
5. Set profit targets at TGT -1 and TGT -2
6. Note the T-SL level for trailing stop management
Trade Management with Targets:
When TGT -1 is Hit:
- Dashboard shows checkmark (-) next to TGT -1
- Book 40-50% of your position
- Move stop to breakeven or just above entry
- Let remainder run toward TGT -2
When TGT -2 is Hit:
- Dashboard shows checkmark (-) next to TGT -2
- Book another 30-40% of position
- Keep 10-20% running with T-SL protection
- Allow T-SL to work its magic on extended trends
When T-SL is Hit:
- Dashboard shows checkmark (-) next to T-SL
- Status shows "TGT-2 hit" or similar
- Exit remaining position
- All profits locked in at maximum level
If Stop Loss is Hit:
- Trade closes with pre-defined loss
- Move to next signal
- Loss is controlled and acceptable per risk management
Trailing Stop Loss Strategy
The T-SL system is designed for maximum profit capture:
How T-SL Works:
1. When price moves in your favor past Target 2, the trend is confirmed strong
2. Instead of exiting, Market Vision has pre-calculated a trailing stop well beyond Target 2
3. As price continues trending, you capture extended moves (sometimes 4-5x Target 2 gains)
4. If trend reverses, T-SL acts as your exit point, securing all profits
Example BUY Trade:
- Entry: 219400
- Target 2: 221096 (+1,696 points)
- T-SL: 225123 (+5,723 points from entry)
If the trend is strong and price reaches 225123, you've captured 3.4x more profit than Target 2. If price reverses before T-SL, you still exit with significant gains above Target 2.
T-SL Best Practices:
- Don't exit manually between Target 2 and T-SL unless Trend Bar shows reversal (color change)
- Let the T-SL do its job - it's calculated based on volatility and trend strength
- Use partial position sizing: close 80% by Target 2, let 20% ride with T-SL protection
- Monitor MaxPts: if it's significantly above current price, trend may be weakening
Using the Trend Bar
The Trend Bar provides real-time trend intelligence:
During Trade Entry:
- BUY Signal + Green Trend Bar = Strong confirmation, higher confidence trade
- SELL Signal + Red Trend Bar = Strong confirmation, higher confidence trade
- Signal + Opposite Color Trend Bar = Weak confirmation, consider smaller position or skip
During Trade Management:
- Green Trend Bar Turning Red (in BUY trade) = Trend weakening, consider booking profits
- Red Trend Bar Turning Green (in SELL trade) = Trend weakening, consider booking profits
- Trend Bar Maintains Color = Trend intact, hold positions per plan
For Position Confidence:
- Long Green Stretch in Trend Bar = Strong uptrend, hold BUY positions longer
- Long Red Stretch in Trend Bar = Strong downtrend, hold SELL positions longer
- Frequent Color Changes = Choppy market, trade with caution or smaller size
The Trend Bar essentially gives you a "second opinion" on trend health without complex analysis.
Performance Metrics Deep Dive
Booked Profits:
Shows your actual realized gains. This is money locked in.
- "Booked: +1696" = You've secured 1,696 points profit (partial bookings at targets)
- "Booked: +376" = You've secured 376 points profit
- This metric tracks discipline - did you book at targets as planned?
MaxPts (Maximum Points):
Shows the best profit level achieved since entry.
- "MaxPts: +9500" = At peak, your trade was up 9,500 points
- "MaxPts: +1653" = Peak profit was 1,653 points
- Compare MaxPts to Booked: If MaxPts is much higher, you let profits slip - next time tighten exits
Strategic Use:
If Booked is 1,696 but MaxPts is 9,500, the trade went much further than where you exited. This isn't necessarily bad - you followed your plan and booked at targets. But it shows the trend was exceptionally strong. On future similar setups, consider letting more position ride toward T-SL.
If Booked and MaxPts are close (within 10-20%), you exited near peak - excellent execution.
Color-Coded Visual System
Market Vision uses strategic color coding:
Dashboard Background:
- Green = BUY signal active
- Red/Maroon = SELL signal active
Candles:
- Green = Bullish trend/BUY period
- Red = Bearish trend/SELL period
Trend Bar:
- Green Bars = Uptrend/bullish momentum
- Red Bars = Downtrend/bearish momentum
On-Chart Labels:
- White/Gray = Entry price line
- Yellow/Orange = Target price lines
- Red/Orange = T-SL and Stop Loss lines
Dashboard Footer "Market Vision" Label:
- Green Background = BUY signal active
- Red Background = SELL signal active
This comprehensive color system creates visual harmony and allows you to assess the situation with a quick glance.
Trading Scenarios
Scenario 1: Strong Trending Market (BUY)
- Signal: BUY 219400
- Entry: 219400
- TGT-1: 220248 - Hit (-) - Book 50% - Booked shows +424 points
- TGT-2: 221096 - Hit (-) - Book 30% - Booked shows +1,272 points
- T-SL: 225123 - Hit (-) - Exit final 20% - Booked shows +1,696+ points
- MaxPts: +9500 (trade extended far beyond T-SL before reversal)
- Trend Bar: Solid green throughout, confirming strong uptrend
- Result: Massive win capturing extended trend move
Scenario 2: Moderate Move (SELL)
- Signal: SELL 227603
- Entry: 227603
- TGT-1: 227415 - Hit (-) - Book 50%
- TGT-2: 227227 - Hit (-) - Book 40%
- T-SL: 226921 - Hit (-) - Exit final 10%
- Booked: +376 points
- MaxPts: +1653 (trade went to 1,653 points from entry before reversal)
- Trend Bar: Red bars confirm downtrend, then mixed colors at reversal
- Result: Solid win with T-SL capturing good extension beyond Target 2
Scenario 3: Stop Loss Scenario
- Signal: BUY 220000
- Entry: 220000
- SL: 218500 - Hit
- Trade closes at -1,500 points loss
- Booked: -1500
- MaxPts: +200 (trade went slightly positive before reversing)
- Trend Bar: Green turned red quickly, showing trend failure
- Result: Controlled loss per risk management plan
Why Choose Market Vision?
For Trend Traders:
The Trailing Stop Loss system is built for trend trading. You can capture extended moves without manual stop adjustments, and the T-SL protects all gains if trends reverse.
For Visual Learners:
Color-coded candles, Trend Bar indicator, and labeled chart lines create a complete visual trading environment. You can understand market conditions at a glance.
For Performance-Focused Traders:
Booked and MaxPts metrics provide transparency. You see both what you've realized and what was possible, helping you improve execution over time.
For Risk-Conscious Traders:
Clear Stop Loss levels for risk management, plus intelligent T-SL for profit protection. You always know your risk and your protected gains.
For Confirmation Seekers:
The Trend Bar provides independent trend confirmation. When signals align with Trend Bar colors, you trade with higher confidence.
For Profit Maximizers:
The T-SL system ensures you don't leave money on the table during strong trends. Target 2 may be hit, but T-SL keeps you in for exceptional moves.
Technical Specifications
- Platform: MetaTrader 4 (MT4)
- Trading Styles: Intraday and positional trading (all styles)
- Timeframes: All (M1, M5, M15, M30, H1, H4, D1, W1)
- Instruments: All (Stocks, Indices, Forex, Commodities, Cryptocurrencies, Futures)
- Signal Components: Entry, Stop Loss, Target 1, Target 2, Trailing Stop Loss (T-SL)
- Performance Metrics: Booked (realized profit), MaxPts (peak profit)
- Visual Components: Trend Bar indicator (color-coded bars), color-coded candles, labeled chart lines
- Target Confirmation: Checkmark (-) system for achieved targets
- Status Display: Trade status messages (e.g., "TGT-2 hit")
- Theme Options: Dark (default) and Light chart backgrounds
- Dashboard: Compact, color-coded, real-time updates
- Repainting: No (signals are final and permanent)
Package Includes
- Market Vision MT4 Indicator (.ex4 file)
- Installation Guide (PDF)
- Complete User Manual (PDF)
- Trailing Stop Loss Strategy Guide (PDF)
- Trend Bar Analysis Tutorial (PDF)
- Video Tutorial - Installation & Setup
- Video Tutorial - Understanding T-SL System
- Video Tutorial - Trading with Trend Bar Confirmation
- Video Tutorial - Performance Metrics (Booked vs MaxPts)
- Video Tutorial - Complete Trade Management Workflow
- Lifetime License (Single Account)
- Free Updates for 1 Year
- Email Support
See the Market Clearly, Trade with Vision
Market Vision goes beyond basic signal indicators by providing two critical advantages: intelligent profit protection through Trailing Stop Loss, and real-time trend confirmation through the Trend Bar analyzer.
While other indicators tell you when to enter, Market Vision tells you when to enter, how to manage the trade, where to book profits, and how to capture extended trend moves while protecting everything you've gained.
The Trend Bar gives you trend confidence, the T-SL gives you profit security, and the performance metrics give you execution transparency.
This is not just another indicator - it's a complete trading system designed to help you see opportunities clearly and execute trades confidently.
Trade with vision. Trade with Market Vision.
========================================
FEATURE HIGHLIGHTS (Bullet Points)
========================================
- Trailing Stop Loss (T-SL) System - Automatically calculated adaptive trailing stop for maximum profit capture
- Trend Bar Indicator - Real-time color-coded bar panel showing trend strength (green for uptrend, red for downtrend)
- Complete Trade Setup - Entry, SL, TGT-1, TGT-2, and T-SL for every signal
- Checkmark Confirmation System - Visual checkmarks (-) show when targets are achieved
- Dual Performance Metrics - Booked (realized profit) and MaxPts (peak profit) tracking
- Color-Coded Candles - Full chart candle coloring (green for bullish, red for bearish trends)
- On-Chart Labeled Lines - ENTRY, TGT-1, TGT-2, T-SL clearly labeled on chart
- Trade Status Display - Real-time status updates (e.g., "TGT-2 hit")
- Trend Confirmation - Trend Bar provides independent trend validation for signals
- Light/Dark Theme Support - Switch between chart backgrounds for any environment
- Signal-Colored Dashboard - Green background for BUY, red for SELL instant recognition
- Extended Profit Capture - T-SL positioned beyond Target 2 to capture strong trend extensions
- Visual Harmony - Color coordination across dashboard, candles, Trend Bar, and chart labels
- License Expiry Tracker - Dashboard countdown for subscription management
- Universal Compatibility - All timeframes, all instruments
- No Repainting - Signals are permanent and reliable
========================================
FAQ (Frequently Asked Questions)
========================================
Q: What is T-SL (Trailing Stop Loss) and how is it different from regular Stop Loss?
A: The regular SL (Stop Loss) is your initial risk protection level - if price goes against you, the SL limits your loss. The T-SL (Trailing Stop Loss) is an advanced profit protection level positioned beyond your Target 2. It's designed to capture extended trend moves while protecting all gains. If a trend is strong and price continues past Target 2, the T-SL allows you to stay in the trade and capture exceptional profits. If the trend reverses, the T-SL acts as your exit point, ensuring you lock in all profits earned beyond Target 2.
For example, in a BUY signal:
- SL protects your downside (e.g., 218340)
- Target 1 and 2 are your planned profit exits (220248, 221096)
- T-SL captures extended moves if trend continues (225123)
You might exit 80% at targets and let 20% ride with T-SL protection, turning a good trade into a great trade on strong trends.
Q: How do I use the Trend Bar indicator?
A: The Trend Bar is the colored bar panel at the bottom of your chart. Green bars indicate uptrend/bullish momentum, red bars indicate downtrend/bearish momentum.
For Trade Entry: When you receive a BUY signal, check the Trend Bar. If it's showing green bars, you have trend confirmation - trade with confidence. If it's showing red bars despite a BUY signal, trend confirmation is weak - trade smaller or skip.
During Trades: If you're in a BUY trade and Trend Bar starts turning red, the trend may be weakening. Consider booking profits early. If Trend Bar maintains green throughout, trend is strong - hold for targets.
Quick Glance Analysis: Instead of analyzing complex chart patterns, just look at Trend Bar colors. Solid green = uptrend, solid red = downtrend, mixed colors = choppy market.
Q: What do Booked and MaxPts mean?
A: These are your performance metrics:
Booked = Realized profit/loss in points. This is what you've actually locked in by closing positions at targets. Example: "Booked: +1696" means you've secured 1,696 points profit.
MaxPts = Maximum profit the trade achieved since entry, even if price has since pulled back. Example: "MaxPts: +9500" means at some point your trade was up 9,500 points.
Strategic Use: Compare Booked to MaxPts. If MaxPts is much higher (e.g., MaxPts: 9500, Booked: 1696), the trade went far beyond where you exited. On future similar setups, consider letting more position ride toward T-SL to capture extended moves.
If Booked and MaxPts are close, you exited near peak - excellent execution timing.
Q: How should I manage positions with Market Vision's multi-target system?
A: Recommended position management:
At Entry:
- Enter full position size at Entry price
- Set stop at SL level
When Target 1 is Hit (- appears):
- Book 40-50% of position
- Move stop to breakeven (or just above Entry) on remainder
- This locks in partial profits and makes the trade risk-free
When Target 2 is Hit (- appears):
- Book another 30-40% of position
- Keep 10-20% running with T-SL protection
- Booked profits are now substantial
Let T-SL Work:
- The remaining 10-20% rides with T-SL protection
- If trend continues, T-SL captures extended moves (sometimes 3-5x Target 2 gains)
- If trend reverses, T-SL exit secures maximum profit
- Watch Trend Bar: if it changes color, consider manual exit before T-SL
This approach balances profit booking (security) with profit maximization (T-SL extension).
Q: Can I use Market Vision on any timeframe and instrument?
A: Yes, Market Vision works on all timeframes (M1 to W1) and all instruments (stocks, forex, commodities, indices, crypto, futures). The indicator adapts to the instrument's volatility and calculates appropriate target levels and T-SL based on the specific market conditions.
Recommended Timeframes:
- Intraday Traders: M5, M15, M30 for frequent signals
- Swing Traders: H1, H4 for multi-hour trends
- Positional Traders: H4, D1 for multi-day trends
Recommended Instruments:
- Stocks, Futures, Indices with good liquidity
- Major Forex pairs (EUR/USD, GBP/USD, etc.)
- Popular Commodities (Gold, Silver, Oil)
- High-volume Cryptocurrencies (BTC, ETH)
Q: What if the Trend Bar and the signal don't match (e.g., BUY signal but red Trend Bar)?
A: This indicates weak trend confirmation. You have a few options:
Option 1 (Conservative): Skip the trade. If trend confirmation is weak, the setup may fail.
Option 2 (Cautious): Trade with smaller position size (25-50% of normal size) since confidence is lower.
Option 3 (Active Trader): Take the trade but plan to exit at Target 1 only, don't hold for Target 2 or T-SL.
What It Means: A BUY signal with red Trend Bar suggests price may be at a short-term reversal point, but the broader trend is still down. Trade with caution.
Ideal Scenarios:
- BUY signal + Green Trend Bar = Strong confirmation
- SELL signal + Red Trend Bar = Strong confirmation
Q: Does Market Vision repaint signals?
A: No, Market Vision does not repaint. Once a BUY or SELL signal appears on your chart with Entry, SL, TGT-1, TGT-2, and T-SL levels, those levels are permanent and final. You can trust the signals for historical analysis and live trading.
Q: How is Market Vision different from other signal indicators?
A: Market Vision has three unique advantages:
1. Trailing Stop Loss (T-SL) - Most indicators only provide 1-2 targets. Market Vision adds an intelligent T-SL that captures extended trend moves while protecting all profits. This single feature can multiply your gains on strong trends.
2. Trend Bar Confirmation - You get a dedicated trend strength indicator at chart bottom. This provides independent confirmation for signals, reducing false trades and increasing confidence.
3. Booked + MaxPts Metrics - Most indicators don't track performance. Market Vision shows both realized profits (Booked) and peak potential (MaxPts), helping you improve execution over time.
These three features transform Market Vision from a signal indicator into a complete trading system.
========================================
RECOMMENDED TRADING APPROACH
========================================
Standard Strategy:
1. Wait for BUY or SELL signal to appear
2. Check Trend Bar for trend confirmation:
- BUY + Green Trend Bar = Strong confirmation, full position
- SELL + Red Trend Bar = Strong confirmation, full position
- Signal + Opposite Trend Bar = Weak confirmation, smaller position or skip
3. Enter at displayed Entry price
4. Set stop loss at SL level
5. When Target 1 shows -, book 40-50% position, move stop to breakeven
6. When Target 2 shows -, book 30-40% more, keep 10-20% running
7. Let remaining position ride with T-SL protection
8. Monitor Trend Bar: if color changes against your position, consider early exit
9. If T-SL is hit (- appears), exit final position with maximum profit secured
Conservative Approach (Prioritizing Safety):
- Only trade when signal matches Trend Bar color (BUY+Green, SELL+Red)
- Book 60% at Target 1, 30% at Target 2, 10% rides to T-SL
- Move stop to breakeven immediately after Target 1
- Exit manually if Trend Bar changes color (don't wait for T-SL)
- Focus on Booked profits, not MaxPts
- Trade higher timeframes (H1, H4) for fewer but higher-quality signals
Aggressive Approach (Maximizing T-SL Potential):
- Trade all signals regardless of Trend Bar confirmation
- Book 30% at Target 1, 20% at Target 2, keep 50% running to T-SL
- Hold positions even if Trend Bar shows mixed colors (trust T-SL protection)
- Trade lower timeframes (M5, M15) for more frequent opportunities
- Focus on MaxPts potential, use Booked as secondary metric
- On strong trends (solid green or red Trend Bar), consider holding even past T-SL
Trend Bar-Based Position Sizing:
- BUY + Solid Green Trend Bar (5+ consecutive bars): Trade 100% position size, high confidence
- BUY + Mixed Trend Bar (green with red bars): Trade 50% position size, medium confidence
- BUY + Red Trend Bar: Trade 25% position size or skip, low confidence
- Apply same logic for SELL signals with red Trend Bar
Using MaxPts for Exit Decisions:
During an active trade, monitor MaxPts vs current price:
- If MaxPts is only slightly above current Live P/L (within 5-10%), you're near peak - hold per plan
- If MaxPts is significantly above current position (20-30% pullback), price has retraced from peak - consider early exit or tightening stop manually
- If MaxPts keeps rising, trend is extending - excellent trade development, hold for T-SL
Timeframe-Specific Approaches:
M5/M15 (Scalping/Intraday):
- Expect 3-8 signals per session
- Book profits faster (60% at TGT-1, 30% at TGT-2)
- Use Trend Bar for quick confirmation
- T-SL captures intraday extension moves
H1/H4 (Swing Trading):
- Expect 1-3 signals per day
- Hold for full target sequence (40%/30%/30% split)
- T-SL captures multi-day trend extensions
- Give trades more time to develop
D1 (Positional Trading):
- Expect 1-2 signals per week
- Hold patiently for all targets
- T-SL may take days/weeks to trigger
- Focus on MaxPts potential, be patient
========================================
TRAILING STOP LOSS (T-SL) STRATEGY GUIDE
========================================
What Makes T-SL Special:
Traditional target-based trading has a problem: you exit at Target 2, but the trend continues for another 2,000-5,000 points and you miss it. You followed your plan, but you left massive profits on the table.
Market Vision solves this with Trailing Stop Loss (T-SL):
- T-SL is calculated beyond Target 2
- It locks in all your Target 1 and Target 2 gains
- It allows you to capture extended trend moves without risk
- If the trend continues, you stay in for exceptional profits
- If the trend reverses, T-SL exits you with maximum gains
How to Use T-SL:
Position Sizing for T-SL:
After booking at Target 1 (50%) and Target 2 (30-40%), you have 10-20% position left. This remaining portion rides with T-SL protection.
Psychology of T-SL:
Don't think "I'm risking my profits" by holding past Target 2. You've already booked 70-90% of the position. The T-SL protects everything. You're not risking - you're maximizing with protection.
When T-SL Shines:
- Strong trending days (stocks up 8-12%)
- Breakout moves (price breaks resistance and runs)
- News-driven trends (earnings, economic data)
- Clear Trend Bar confirmation (solid green or red bars throughout)
T-SL Warning Signs:
If Trend Bar changes color after Target 2 but before T-SL, consider manual exit. The T-SL is still protection, but trend weakening suggests lower probability of reaching T-SL profitably.
T-SL Success Example:
- Entry: 219400
- Target 1: 220248 (+848 pts) - Book 50%
- Target 2: 221096 (+1,696 pts from entry) - Book 40%
- T-SL: 225123 (+5,723 pts from entry) - Final 10% exits here
- Result: Average exit = (50% x 848) + (40% x 1,696) + (10% x 5,723) = 1,574 pts
- Without T-SL: Average exit = (50% x 848) + (50% x 1,696) = 1,272 pts
- T-SL Bonus: +302 pts (24% more profit)
T-SL Risk Management:
The remaining 10-20% position after Target 2 is "free risk" - you've already booked more than enough to make the trade profitable. Even if T-SL is hit at breakeven (extremely rare), the trade is still a winner overall.
Q: Should I manually trail stops or trust the T-SL level?
A: Trust the T-SL level. It's calculated based on volatility, ATR, and market structure. Manual trailing often exits too early. Let the system work.
Q: What if price is between Target 2 and T-SL but Trend Bar turns red (in a BUY)?
A: You have two options:
1. Exit manually - trend weakening suggests lower T-SL probability
2. Hold with T-SL protection - you're still protected, and trends can resume
Conservative traders exit, aggressive traders hold. Both are valid.
========================================
TREND BAR ANALYSIS GUIDE
========================================
Understanding Trend Bar Mechanics:
The Trend Bar at chart bottom is a real-time trend strength indicator:
- Green Bars: Bullish momentum, uptrend confirmed
- Red Bars: Bearish momentum, downtrend confirmed
- Bar Length/Intensity: Varies with trend strength
- "Trend Bar 1:0000": Displays trend ratio/measurement
Trend Bar Patterns:
Solid Green (5+ consecutive green bars):
- Strong, confirmed uptrend
- BUY signals highly reliable
- Hold BUY positions confidently
- Avoid SELL signals unless you're counter-trend trading
Solid Red (5+ consecutive red bars):
- Strong, confirmed downtrend
- SELL signals highly reliable
- Hold SELL positions confidently
- Avoid BUY signals unless counter-trend trading
Mixed Colors (alternating green/red):
- Choppy, indecisive market
- Lower signal reliability
- Trade with smaller positions
- Book profits faster at Target 1, don't hold for T-SL
Color Transition (green turning red or red turning green):
- Potential trend reversal
- If in position, consider early exit
- New signals in transition zones are lower confidence
- Wait for solid color confirmation (3+ bars same color)
Trend Bar + Signal Combinations:
Highest Confidence (Trade Full Size):
- BUY Signal + Solid Green Trend Bar
- SELL Signal + Solid Red Trend Bar
Medium Confidence (Trade 50% Size):
- BUY Signal + Mixed Trend Bar
- SELL Signal + Mixed Trend Bar
Low Confidence (Trade 25% or Skip):
- BUY Signal + Solid Red Trend Bar (counter-trend)
- SELL Signal + Solid Green Trend Bar (counter-trend)
Using Trend Bar for Exits:
Scenario: You're in a BUY trade at +1,200 points profit, Target 2 not yet hit:
- Trend Bar still green - Hold per plan
- Trend Bar turns red - Consider booking profits early, trend weakening
Scenario: You're past Target 2, holding for T-SL:
- Trend Bar solid green - Hold confidently for T-SL
- Trend Bar mixed - Hold cautiously, watch for full reversal
- Trend Bar turns solid red - Consider manual exit, trend has reversed
Trend Bar as Confidence Filter:
Use Trend Bar to filter which signals to trade:
- Only trade BUY when Trend Bar is green
- Only trade SELL when Trend Bar is red
- Skip signals with opposite Trend Bar colors
This filtering significantly improves win rate, though reduces trade frequency.
========================================
VISUAL CONTROLS & CUSTOMIZATION
========================================
Light/Dark Theme:
Market Vision supports both chart themes:
Dark Theme:
- Black/dark gray chart background
- Default theme, professional aesthetic
- Optimized for extended screen time
- Reduces eye strain in low-light environments
- Labels and lines stand out clearly
Light Theme:
- White/light chart background
- Clean, modern appearance
- Perfect for bright offices
- Ideal for presentations, screen recording, client presentations
- Easy viewing in well-lit environments
Switching Themes:
Toggle between Dark and Light instantly without affecting signals or functionality. (Specific button shown in dashboard - likely one of the three footer buttons.)
Dashboard Position:
The Market Vision dashboard can be moved to any chart corner for optimal placement based on your trading setup.
Color-Coded Harmony:
All visual elements work together:
- Dashboard background (green/red) matches signal type
- Candles (green/red) match trend direction
- Trend Bar (green/red) confirms trend
- Chart labels coordinate with above
This creates visual unity, making market conditions instantly recognizable.