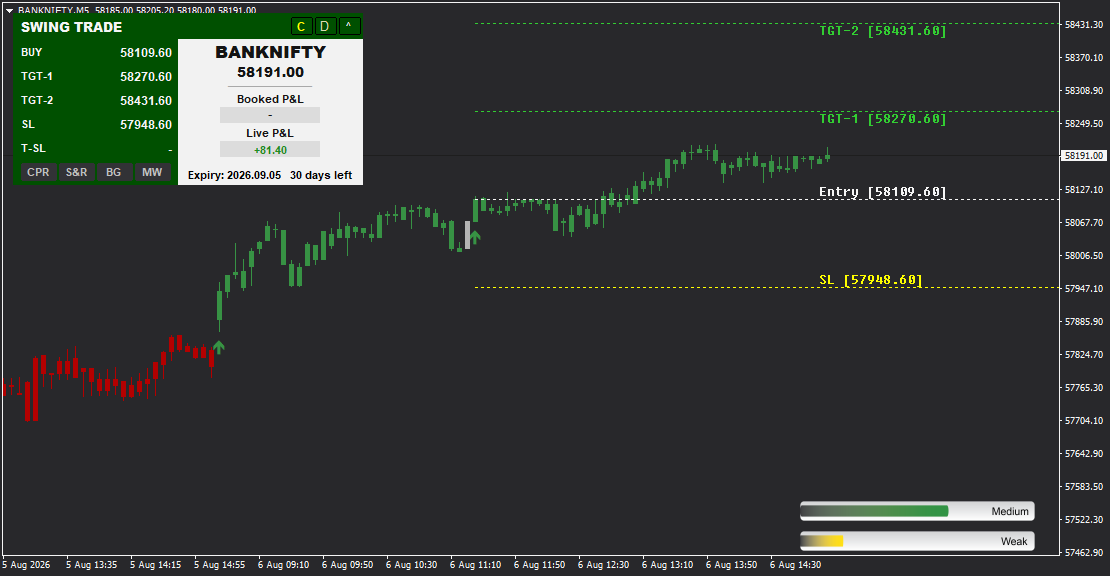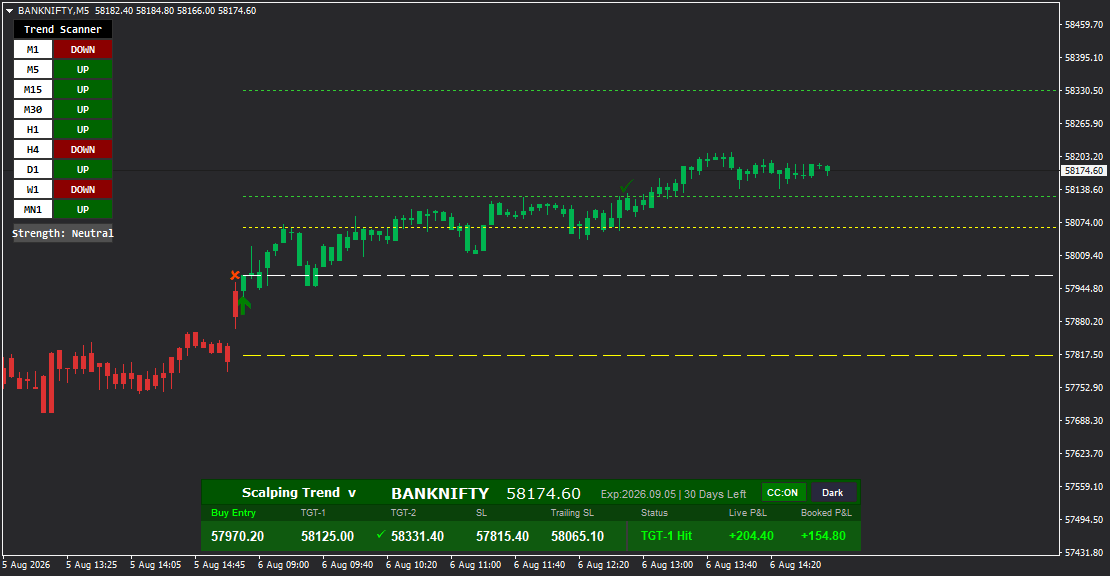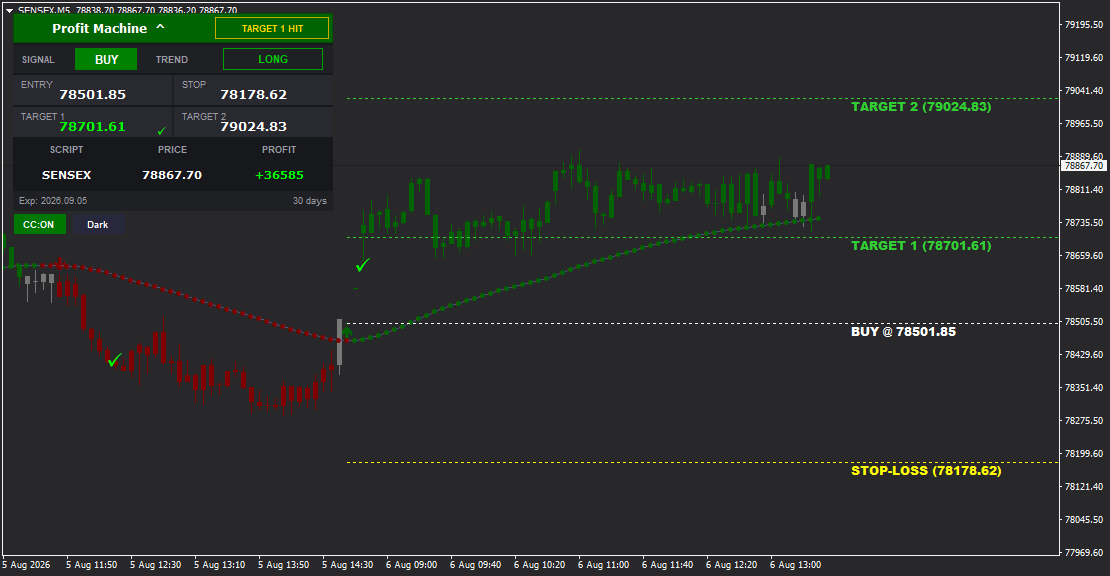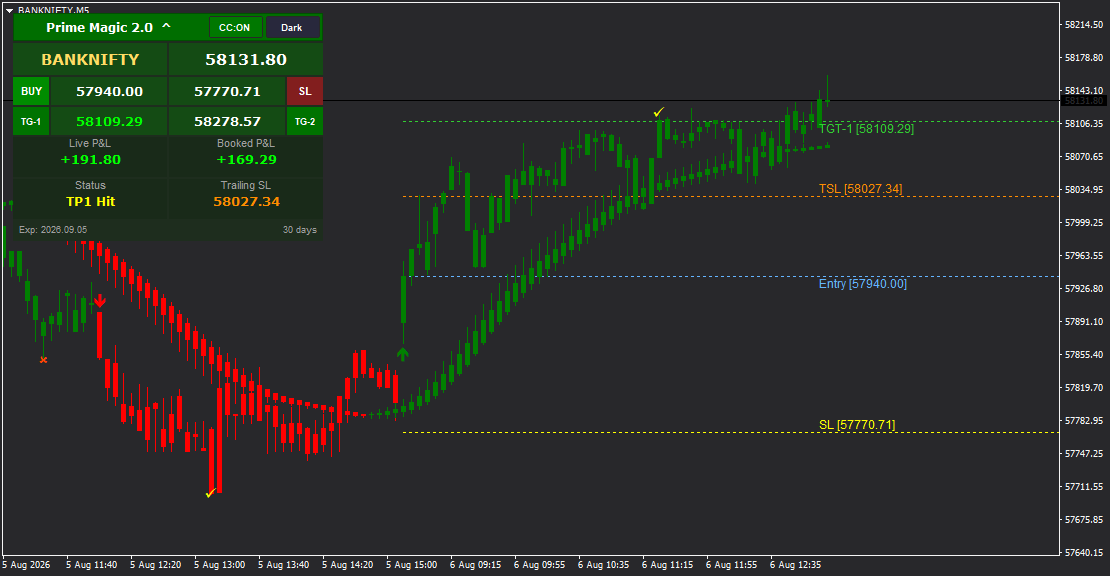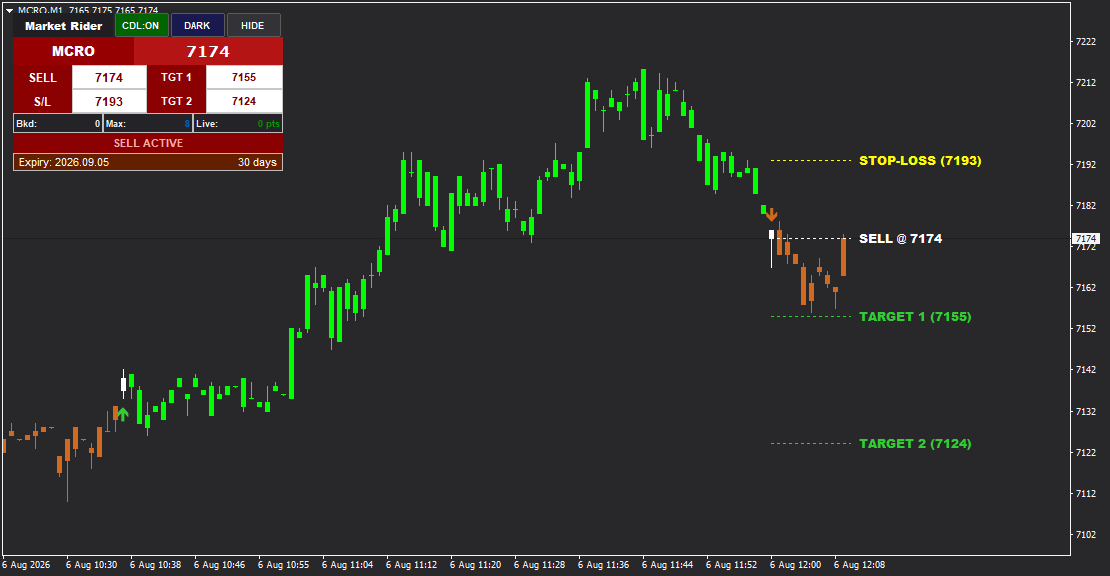

Market Rider is a clean and powerful MT4 indicator designed for both intraday and positional trading, delivering precise BUY and SELL signals with complete trade management including Entry Price, Stop Loss, Target 1, and Target 2. It features real-time MT4 Data Feed performance tracking (Booked, Max, and Live P/L), trade status monitoring, customizable Light/Dark themes, color-coded candle display with COL:ON/OFF toggle, labeled on-chart price lines, and a collapsible dashboard. Perfect for traders who want simplicity without sacrificing essential features.
Market Rider - Simple Yet Powerful Signal System with Complete Trade Management
Our data feed integration ensures precision signal delivery across all trading pairs.
Market Rider is a professional trading indicator for MetaTrader 4 that focuses on what matters most: clear signals, precise trade levels, and real-time performance tracking. This leverages MT4 Data Feed for optimal performance. With its clean, minimalist dashboard and powerful visual tools, Market Rider gives you everything you need to execute trades confidently across all timeframes and instruments.
Whether you're day trading on M5 charts or holding swing positions on daily timeframes, Market Rider delivers BUY and SELL signals with automatically calculated entry points, protective stop losses, and two profit targets - all displayed clearly on both your chart and dashboard.
Key Features
Complete Trade Setup
Every signal provides all essential trade information:
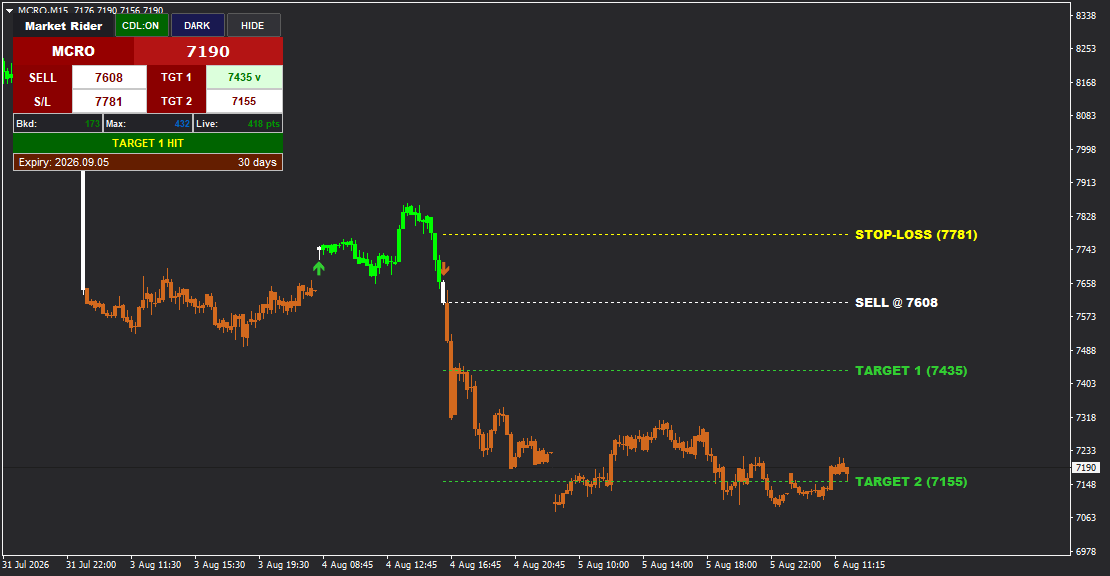
- Entry Price - Exact price to enter the trade (e.g., SELL 7174, SELL 7608)
- S/L (Stop Loss) - Protective stop level (e.g., 7193, 7781)
- TGT 1 (Target 1) - First profit target for partial booking (e.g., 7155, 7435)
- TGT 2 (Target 2) - Extended profit target for maximum gains (e.g., 7124, 7155)
- Clear Signal Arrows - Green upward arrows for BUY, red downward arrows for SELL
Real-Time Performance Tracking
Market Rider displays three key performance metrics:
- Bkd (Booked) - Realized profit/loss in points when targets are hit
- Max - Maximum profit reached since entry (e.g., Max: 8 points)
- Live - Current running profit/loss in real time (e.g., Live: -1 pts, Live: +18 pts)
This three-metric system gives you complete visibility into trade performance at every stage.
Trade Status Monitor
The dashboard displays trade status with clear, color-coded text:
- "SELL ACTIVE" or "BUY ACTIVE" - Trade is currently running (displayed in red for SELL, green for BUY)
- "TARGET 1 HIT" - First target reached (displayed in green)
- "TARGET 2 HIT" - Second target reached (displayed in green)
- "STOP LOSS HIT" - Stop loss triggered (displayed in yellow/orange)
Know exactly where you stand at all times with instant status updates.
Visual Control System
Market Rider gives you full control over chart appearance with three simple toggle buttons:
COL:ON / COL:OFF Button:
- COL:ON (green) - Activates color-coded candles based on trend/signal direction
- Green candles during bullish trends or BUY signals
- Orange/red candles during bearish trends or SELL signals
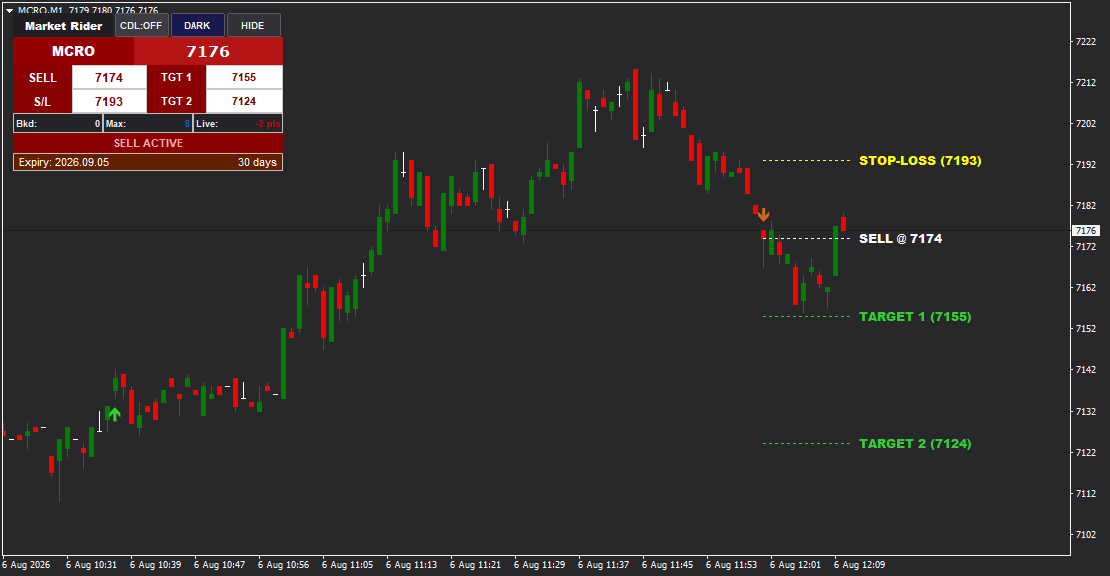
- COL:OFF (gray) - Returns to standard chart candle colors
- Toggle instantly without affecting signal generation
DARK / LIGHT Button:
- DARK - Professional dark chart background (default)
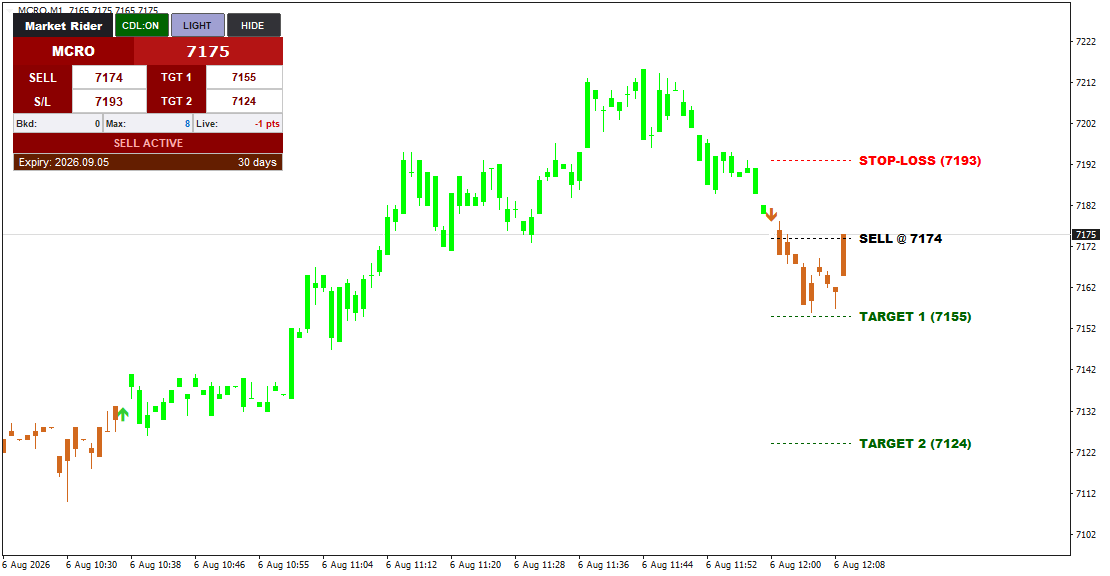
- LIGHT - Clean white/light chart background
- Switch themes instantly based on lighting conditions and preference
HIDE Button:
- Click to collapse the dashboard to minimal view
- Click again to expand back to full dashboard
- Perfect for clean chart presentation or maximum chart space
On-Chart Visual Labels
Market Rider draws clearly labeled horizontal lines directly on your chart:
- STOP-LOSS (price) - Yellow/orange labeled line showing SL level
- SELL @ price or BUY @ price - White labeled line showing entry level
- TARGET 1 (price) - Green labeled line showing first profit target
- TARGET 2 (price) - Green labeled line showing extended profit target
All labels are clear, readable, and positioned for maximum visibility without cluttering the chart.
Dashboard Layout
The Market Rider dashboard is organized for instant readability:
Header:
- "Market Rider" branding
- COL:ON/OFF, DARK/LIGHT, HIDE buttons
Price Display:
- Symbol name (e.g., MCRO)
- Live current price
Trade Information Panel:
- SELL or BUY label with entry price (color-coded: red for SELL, green for BUY)
- S/L - Stop loss price
- TGT 1 - First target with price
- TGT 2 - Second target with price
Performance Metrics:
- Bkd: Booked profit/loss
- Max: Peak profit since entry
- Live: Current running P/L with "pts" label
Status Bar:
- Trade status in color-coded text (e.g., "SELL ACTIVE", "TARGET 1 HIT")
Footer:
- Expiry date with countdown (e.g., "Expiry: 2026.09.05 | 30 days")
How It Works
Signal Generation:
Market Rider analyzes price action, momentum, and market structure to identify high-probability trading opportunities. When a valid setup is detected, it generates a BUY or SELL signal with all trade levels calculated automatically.
Taking Trades:
1. Wait for a BUY (green arrow) or SELL (red arrow) signal to appear on the chart
2. The dashboard immediately updates with SELL/BUY label and all price levels
3. Enter the trade at the displayed entry price
4. Set your stop loss at the S/L level shown
5. Set profit targets at TGT 1 and TGT 2
6. Monitor the Live P/L and Status as the trade develops
Performance Monitoring:
As your trade progresses:
- Live updates continuously showing current profit/loss
- Max shows the best profit level reached (even if price has pulled back)
- Status updates when targets or stop loss are hit
- Bkd shows realized profits when you book at targets
Exit Management:
When TGT 1 is hit:
- Status changes to "TARGET 1 HIT" (green text)
- Book 50-60% of your position
- Let the remainder run toward TGT 2
When TGT 2 is hit:
- Status changes to "TARGET 2 HIT" (green text)
- Close remaining position for maximum profit
If Stop Loss is hit:
- Status changes to "STOP LOSS HIT" (yellow/orange text)
- Trade closes with limited loss as planned
Color-Coded Visual System
Market Rider uses intelligent color coding for instant visual recognition:
Dashboard Colors:
- Red background - SELL signal/trade
- Green background - BUY signal/trade
- White/Gray text - Neutral information (prices)
- Green status text - Positive outcomes (Target Hit)
- Yellow/Orange status text - Stop Loss Hit
On-Chart Labels:
- Yellow/Orange - STOP-LOSS line
- White - Entry price line (SELL @ / BUY @)
- Green - Target 1 and Target 2 lines
Candles (when COL:ON):
- Green candles - Bullish trends, BUY signal periods
- Orange/Red candles - Bearish trends, SELL signal periods
This color system creates visual harmony and helps you maintain situational awareness without reading every label.
Performance Metrics Explained
Bkd (Booked Profit/Loss):
Shows realized gains or losses when you close positions at targets. Example: "Bkd: 0" means no profits booked yet (trade still active). "Bkd: +50" means you've locked in 50 points of profit.
Max (Maximum Profit):
Shows the peak profit your trade has reached since entry. Example: "Max: 8" means at some point, your trade was up 8 points (even if it's currently lower). This helps you understand if you're near the peak or if price has retraced.
Live (Live Profit/Loss):
Shows current running profit or loss in real time. Example: "Live: -1 pts" means you're currently down 1 point. "Live: +18 pts" means you're up 18 points right now. Updates continuously as price moves.
This three-part system gives you complete transparency: what you've booked (Bkd), what you've achieved (Max), and where you are now (Live).
Trading with Market Rider
Intraday Approach (M5, M15, M30):
1. Apply Market Rider to your preferred intraday timeframe
2. Trade signals as they appear throughout the session
3. Watch the Live P/L to monitor trade development
4. Book at TGT 1 (50% position), let remainder run to TGT 2
5. Use the Max metric to understand if price is at peak or has pulled back
Positional Approach (H1, H4, D1):
1. Apply to higher timeframes for swing/positional trading
2. Signals occur less frequently but with larger profit potential
3. Be patient - positional trades may take days to reach targets
4. Monitor Status updates rather than minute-by-minute Live P/L
5. Book partial at TGT 1, hold remainder for TGT 2
Performance-Based Decision Making:
- Check the Max metric: If Max is significantly higher than current Live P/L, price has pulled back. Consider tightening stops or booking profits.
- Monitor Status: When "TARGET 1 HIT" appears, don't delay - book partial profits immediately.
- Use Bkd to track your realized gains and build confidence in the system.
Visual Themes
Dark Theme (Default):
- Black chart background
- Optimized for low-light environments
- Reduces eye strain during extended trading sessions
- Professional aesthetic
- Labels stand out clearly against dark background
Light Theme:
- White/light chart background
- Perfect for bright offices and daytime trading
- Clean, modern appearance
- Ideal for presentations and screen sharing
- Easy on eyes in well-lit environments
Switch instantly with the DARK/LIGHT button - no restart required.
Why Choose Market Rider?
For Traders Who Want Simplicity:
Market Rider focuses on essentials: clear signals, complete trade levels, and real-time tracking. No complex features or information overload. Just what you need, presented clearly.
For Performance-Focused Traders:
The Bkd/Max/Live metric system provides transparency. You can see realized profits (Bkd), peak performance (Max), and current status (Live) all at once. No other indicator offers this three-metric clarity.
For Visual Traders:
Clear on-chart labels with readable text. Color-coded candles (COL:ON) and theme options (DARK/LIGHT) ensure your charts always look exactly how you want.
For Flexible Traders:
Works on all timeframes (M1 to D1) and all instruments (stocks, forex, commodities, indices, crypto). Use the same system for scalping and swing trading.
For Organized Traders:
The Status indicator and performance metrics help you maintain discipline. You always know the current trade state without guessing or manual calculations.
Technical Specifications
- Platform: MetaTrader 4 (MT4)
- Trading Styles: Both intraday and positional trading
- Timeframes: All (M1, M5, M15, M30, H1, H4, D1, W1)
- Instruments: All (Stocks, Indices, Forex, Commodities, Cryptocurrencies)
- Signal Components: Entry, Stop Loss, Target 1, Target 2
- Performance Metrics: Bkd (Booked), Max (Peak), Live (Current) in points
- Visual Controls: COL:ON/OFF (candle colors), DARK/LIGHT (theme), HIDE (dashboard collapse)
- Status Monitoring: SELL/BUY ACTIVE, TARGET 1 HIT, TARGET 2 HIT, STOP LOSS HIT
- Visual Elements: On-chart labeled lines (STOP-LOSS, Entry, Targets), signal arrows, color-coded candles
- Dashboard: Collapsible, movable, real-time updates
- Repainting: No (all signals are final and permanent)
Package Includes
- Market Rider MT4 Indicator (.ex4 file)
- Installation Guide (PDF)
- User Manual - Complete Trading Guide (PDF)
- Performance Metrics Handbook (PDF)
- Video Tutorial - Setup & Configuration
- Video Tutorial - Trading with Market Rider
- Video Tutorial - Understanding Bkd/Max/Live Metrics
- Video Tutorial - Visual Controls & Customization
- Lifetime License (Single Account)
- Free Updates for 1 Year
- Email Support
Ride the Market with Clarity and Confidence
Market Rider represents trading indicator design at its best: powerful functionality wrapped in a clean, simple interface. No clutter. No complexity. Just clear signals, precise levels, real-time tracking, and the visual controls you need.
Whether you're capturing intraday swings or riding multi-day trends, Market Rider gives you everything necessary for confident execution and disciplined trade management.
Start trading with clarity today - let Market Rider guide you to better entries, protected stops, and consistent results.
========================================
FEATURE HIGHLIGHTS (Bullet Points)
========================================
- Complete Trade Setup - Entry, Stop Loss, Target 1, Target 2 for every signal
- Three-Metric Performance Tracking - Bkd (Booked), Max (Peak), Live (Current) P/L
- Trade Status Monitor - SELL/BUY ACTIVE, TARGET HIT, STOP LOSS HIT with color coding
- On-Chart Labeled Lines - STOP-LOSS, Entry, TARGET 1, TARGET 2 clearly marked
- Clear Signal Arrows - Green for BUY, red for SELL
- COL:ON/OFF Toggle - Enable/disable color-coded candles instantly
- DARK/LIGHT Theme Switch - Change chart background with one click
- Collapsible Dashboard - HIDE button for clean chart presentation
- Real-Time Live P/L - Current profit/loss updating continuously in points
- Max Profit Tracking - See peak profit reached since entry
- Booked P/L Display - Track realized profits when targets are hit
- Clean Dashboard Layout - Essential information only, no clutter
- Color-Coded Status - Green for targets hit, yellow/orange for SL hit
- License Expiry Tracker - Countdown display for subscription management
- Universal Compatibility - Works on all timeframes and instruments
- No Repainting - Signals are final and permanent
========================================
RECOMMENDED TRADING APPROACH
========================================
Basic Strategy:
1. Wait for BUY or SELL arrow signal on chart
2. Check dashboard for entry price, S/L, TGT 1, and TGT 2
3. Enter at the displayed entry price
4. Set stop loss at S/L level
5. Monitor Live P/L as trade develops
6. Book 50% at TGT 1 when Status shows "TARGET 1 HIT"
7. Hold remainder for TGT 2 or exit if Max profit shows significant pullback
Conservative Approach:
- Book 60-70% of position at TGT 1
- Move stop to breakeven on remaining position
- Exit remainder at TGT 2 or if Status changes to "STOP LOSS HIT"
- Use COL:ON to enable color-coded candles for additional trend confirmation
Aggressive Approach:
- Book only 30-40% at TGT 1
- Hold majority of position for TGT 2
- Monitor Max metric - if it's significantly higher than current Live P/L, consider manual exit
- Trade multiple signals on lower timeframes (M5, M15)
Max Profit Utilization:
- If Max is 20 points but Live is only 8 points, price has retraced 12 points from peak
- This signals potential reversal - consider booking profits or tightening stops manually
- If Max and Live are close (within 2-3 points), you're near peak performance - hold for targets
========================================
VISUAL CONTROL GUIDE
========================================
COL:ON / COL:OFF Toggle:
- COL:ON (green button): Activates color-coded candles
- Green candles during bullish trends/BUY signals
- Orange/red candles during bearish trends/SELL signals
- Provides instant visual trend confirmation
- COL:OFF (gray button): Standard chart candle colors
- Use when you prefer traditional candlestick analysis
- Reduces visual distraction
DARK / LIGHT Toggle:
- DARK: Black background, professional trading aesthetic
- Best for low-light environments
- Reduces eye strain during extended sessions
- LIGHT: White background, clean modern look
- Perfect for well-lit offices
- Ideal for presentations and screen recording
HIDE Button:
- Collapses dashboard to minimal label
- Maximizes chart space
- Perfect for clean screenshots
- Click again to restore full dashboard
========================================
PERFORMANCE METRICS GUIDE
========================================
Understanding Bkd (Booked P/L):
- Shows realized profit/loss
- Updates when you close positions at targets
- "Bkd: 0" = No profits realized yet (trade still active or no positions closed)
- "Bkd: +50" = You've locked in 50 points of profit
- Helps track your actual realized gains vs. paper profits
Understanding Max (Maximum Profit):
- Shows the highest profit reached since trade entry
- Even if price has pulled back, Max shows the peak
- Example: "Max: 8" means trade was up 8 points at some point
- Use case: If Max is 20 but Live is 10, price has retraced 10 points - consider tightening stops
Understanding Live (Current P/L):
- Real-time running profit/loss
- Updates continuously as price moves
- "Live: -1 pts" = Currently down 1 point
- "Live: +18 pts" = Currently up 18 points
- Shows your exact position right now
Three-Metric Strategy:
- Live shows current status
- Max shows what you could have achieved (helps with exit timing)
- Bkd shows what you've actually realized (tracks performance).