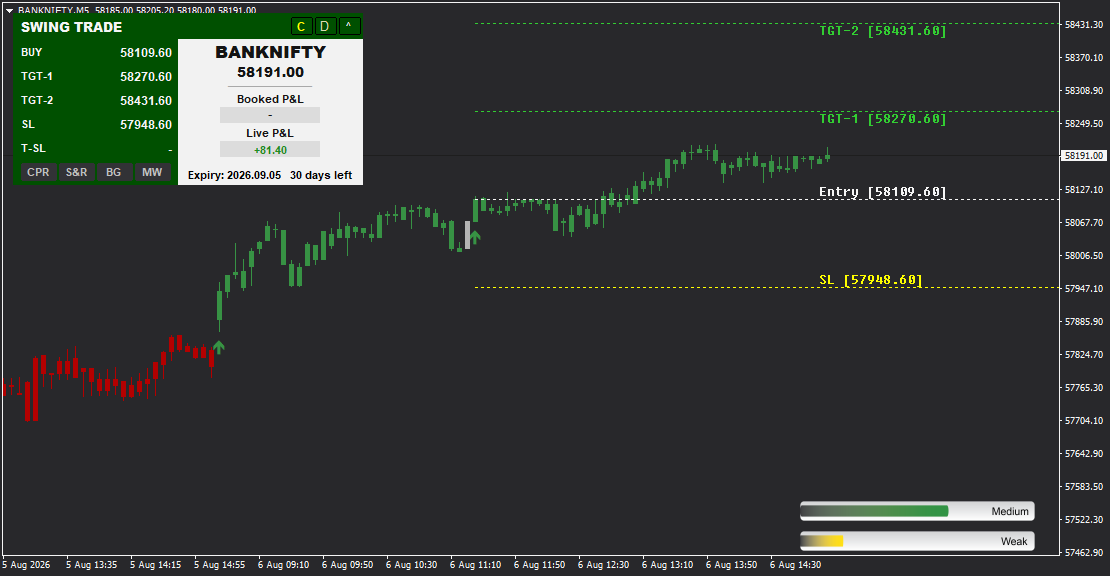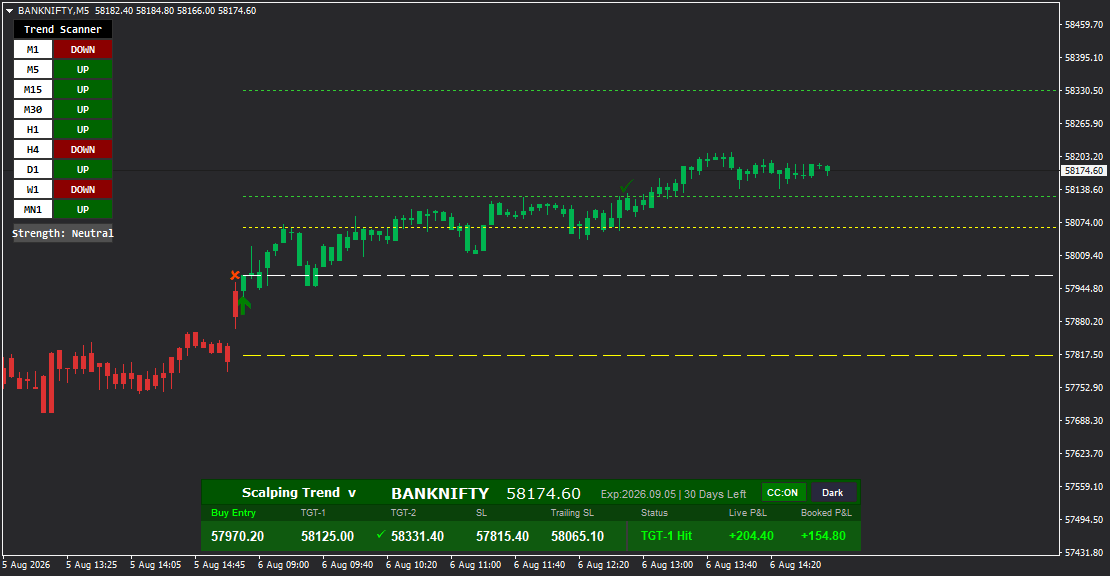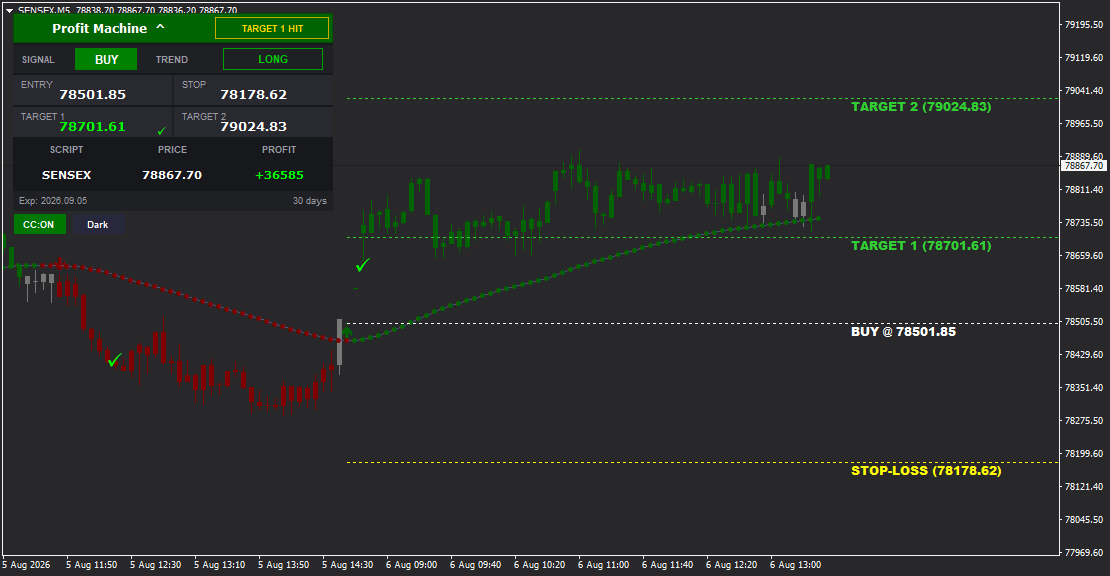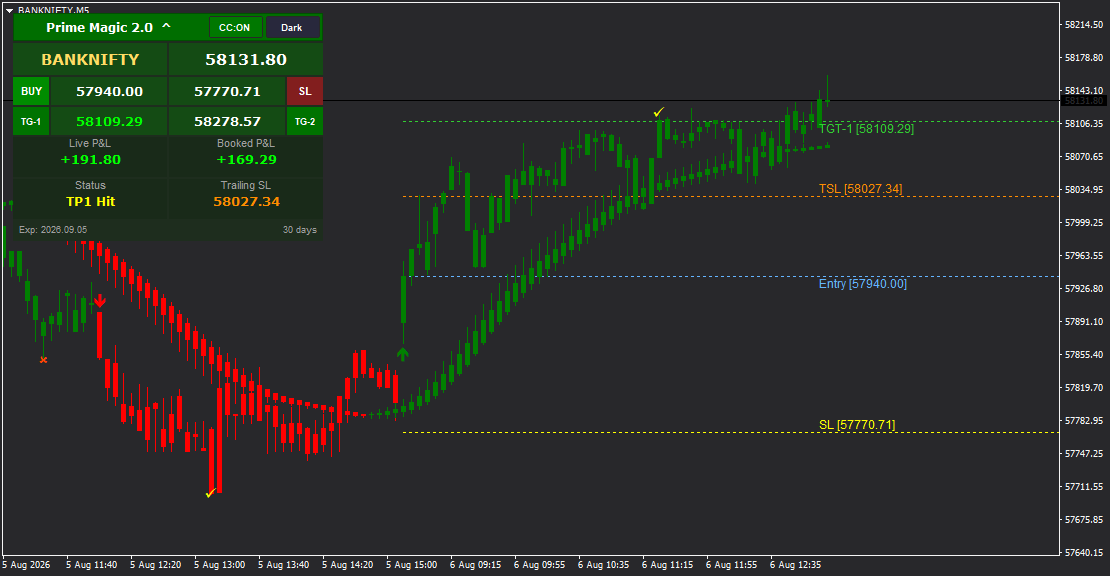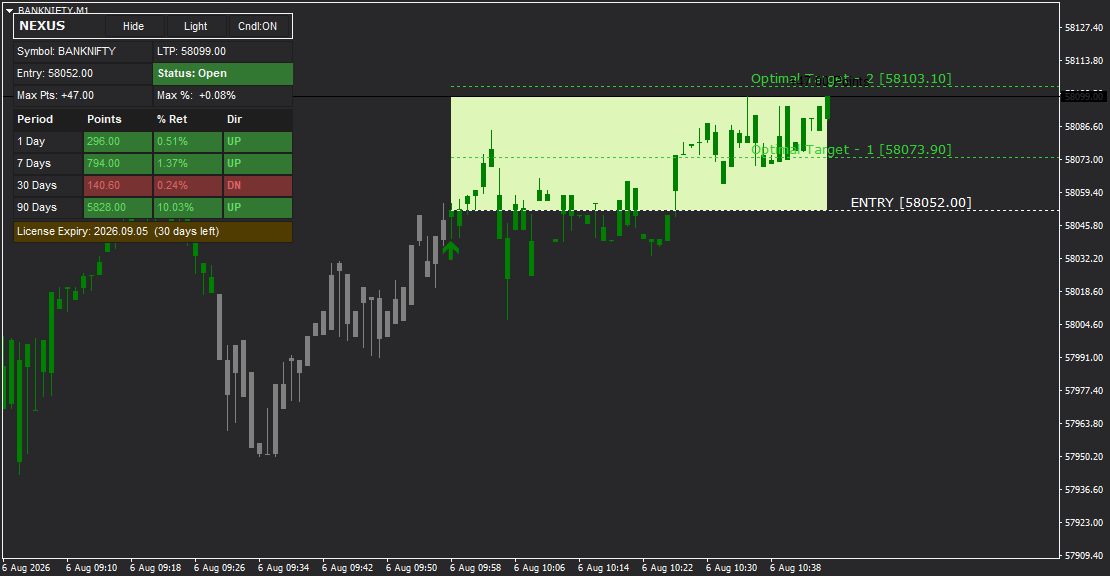

NEXUS is an intelligent MT4 indicator designed for both intraday and positional trading, featuring precise BUY and SELL signals with an innovative Optimal Target Zone system using MT4 Data Feed. It includes Entry Price, Target 1, and Optimal Target-2 with visual zone highlighting, comprehensive performance tracking (1-day, 7-day, 30-day, 90-day statistics), live Max Points/Max % monitoring, customizable Light/Dark themes, color-coded candles, and a collapsible dashboard. Perfect for traders who want clear entry signals with performance analytics and optimized profit targets.
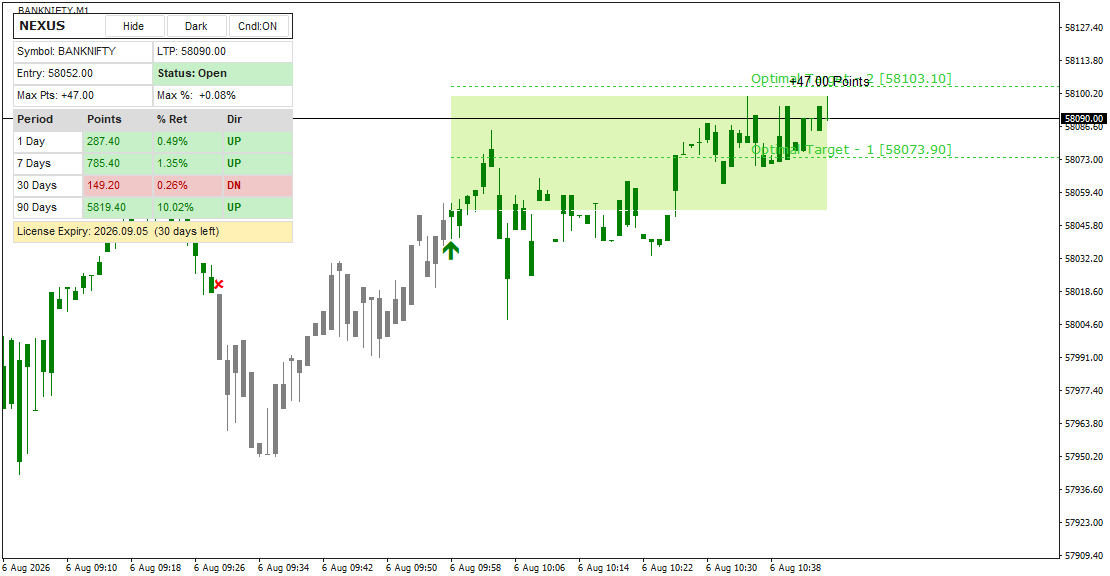
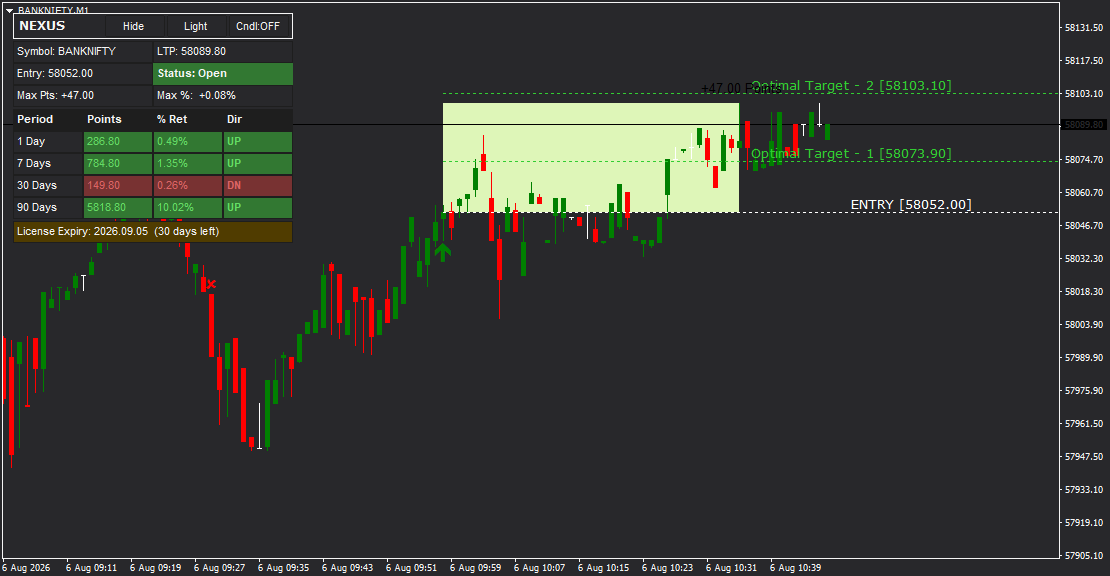
NEXUS - Smart Signal System with Optimal Target Zones
NEXUS is a professional trading indicator for MetaTrader 4 that combines clear BUY/SELL signals with intelligent profit target optimization. This leverages MT4 Data Feed for optimal performance. What makes NEXUS unique is its "Optimal Target Zone" system - instead of just providing fixed targets, NEXUS highlights the optimal profit-taking zone on your chart where the probability of reaching the target is highest while reward remains substantial.
Whether you're day trading on lower timeframes or holding swing positions on higher timeframes, NEXUS adapts to provide signals with complete trade information, real-time performance tracking, and visual optimal zones that guide your profit-taking decisions.
Key Features
Optimal Target Zone System
NEXUS doesn't just give you a Target 2 price - it identifies and highlights an "Optimal Target Zone" on your chart with a distinctive light green/yellow shaded area. This zone represents the sweet spot where:
- The probability of price reaching this area is high
- The reward is significant enough to justify holding the position
- Risk/reward ratio is optimized based on current market conditions
When price enters this optimal zone, you have visual confirmation that you're in the ideal profit-taking area. This takes the guesswork out of deciding when to exit for maximum gains.
Complete Trade Management
Every signal includes:
- Entry Price - Exact price level to enter the trade
- Target 1 - Conservative first profit target for partial booking
- Optimal Target-2 - Extended target within the highlighted optimal zone
- Clear on-chart arrows (green for BUY, red for SELL)
- Labeled price level lines
Real-Time Performance Analytics
The NEXUS dashboard includes a comprehensive performance tracking table showing:
- 1 Day: Points gained, % return, direction (UP/DN)
- 7 Days: Week performance with points and percentage
- 30 Days: Monthly performance statistics
- 90 Days: Quarterly performance overview
This performance table gives you instant insight into how the indicator has performed across different timeframes, helping you gauge current signal reliability and system health.
Live Trade Monitoring
While a trade is active, NEXUS displays:
- Status: Open, Target Hit, or Closed
- Max Pts: Peak profit in points since entry (e.g., +47.00)
- Max %: Peak profit percentage since entry (e.g., +0.08%)
- LTP (Last Traded Price): Current market price updating in real-time
The "Max Points" and "Max %" metrics show you the best profit level your trade has reached, helping you understand if you're near the peak or if price has pulled back.
Visual Control System
NEXUS gives you complete control over chart appearance:
Hide Button:
- Collapses the full dashboard to a minimal "NEXUS" label
- Click again to expand back to full view
- Perfect for clean chart presentation or screenshots
Light/Dark Toggle:
- Switch instantly between light and dark chart backgrounds
- Adapts to your workspace lighting and personal preference
- No restart required
Cndl ON/OFF Toggle:
- Cndl ON: Candles display in signal colors (green for BUY periods)
- Cndl OFF: Candles display in standard chart colors
- Great for traders who prefer traditional candlestick analysis
Dashboard Layout
The NEXUS dashboard is organized in a clean, compact panel:
Header:
- NEXUS branding
- Hide button for dashboard collapse
- Light and Cndl ON/OFF toggle buttons
Trade Information:
- Symbol name (e.g., BANKNIFTY)
- LTP (Last Traded Price) updating in real time
- Entry price for current signal
- Max Pts and Max % reached since entry
- Status indicator (Open/Closed) with color coding
Performance Table:
Four rows showing performance across timeframes:
- Period | Points | % Ret | Dir
- Color-coded: Green for profitable periods (UP), Pink/Red for down periods (DN)
- Instant visual assessment of indicator performance
Footer:
- License expiry date with countdown (e.g., "2026.09.05 (30 days left)")
How It Works
Signal Generation:
NEXUS analyzes price action, momentum, and market structure to identify high-probability trading opportunities. When a setup is confirmed, it generates a signal with all trade levels calculated automatically.
Optimal Zone Calculation:
For every signal, NEXUS calculates not just a fixed Target 2, but an "Optimal Target Zone" based on:
- Current volatility levels
- Support/resistance structure
- Probability of target achievement
- Risk/reward optimization
This zone is highlighted directly on your chart with a light green/yellow shaded area, giving you a clear visual target region rather than just a single price line.
Trade Execution:
1. Wait for a BUY (green arrow) or SELL (red arrow) signal
2. Enter at the displayed Entry price
3. Set your first profit target at Target 1
4. Watch as price moves toward the Optimal Target-2 zone
5. When price enters the highlighted optimal zone, take profits on remaining position
6. Monitor the performance table to track indicator effectiveness
Performance Tracking:
Throughout your trading, NEXUS maintains performance statistics across multiple timeframes. This helps you:
- Understand current market conditions (if all timeframes show UP, momentum is strong)
- Gauge signal reliability (check recent performance before taking new signals)
- Identify when market conditions may be changing
- Build confidence through transparent performance metrics
Visual Elements
On-Chart Display:
- Optimal Target Zone: Light green/yellow shaded horizontal area marking the ideal profit-taking region
- Entry Line: Dotted line with "ENTRY [price]" label
- Target 1 Line: Dotted line with "Target - 1 [price]" label
- Optimal Target-2 Line: Dotted line with "Optimal Target - 2 [price]" label at the top of the optimal zone
- Signal Arrows: Green upward arrows for BUY, red downward arrows for SELL
- Color-Coded Candles (optional): Green candles during BUY signal periods
Color System:
- Green: BUY signals, profitable periods, UP direction
- Red/Pink: SELL signals, down periods, DN direction
- Light Green/Yellow: Optimal target zone highlighting
Why the Optimal Zone Matters
Traditional indicators give you a fixed Target 2 price. But what if that exact price is just beyond a strong resistance level that's unlikely to be reached? Or what if you could hold for an even better target with minimal additional risk?
The Optimal Zone solves this by identifying a *range* rather than a single price where:
- The probability of reaching this zone is high (you're likely to get there)
- The reward is substantial (worth holding the position)
- The risk of reversal before reaching the zone is acceptable
When price enters the highlighted optimal zone on your chart, you have visual confirmation that you're in the ideal profit-taking area. You can book profits confidently knowing you've reached the statistically optimal exit point.
Performance Transparency
NEXUS shows you its performance across four timeframes right on the dashboard. This transparency helps you:
Build Confidence:
When you see consistent positive performance across 1-day, 7-day, and 90-day periods, you know the system is working well in current market conditions.
Identify Market Shifts:
If recent performance (1-day, 7-day) is down while longer-term (90-day) is up, market conditions may be changing. Exercise caution with new signals.
Assess Signal Quality:
Before taking a new signal, glance at the performance table. Strong recent performance increases confidence in the current signal.
Track Your Results:
Compare your own trading results with the performance table to ensure you're executing signals effectively.
Trading with NEXUS
Intraday Approach (M5, M15, M30, H1):
1. Apply NEXUS to your preferred intraday timeframe
2. Wait for a clear arrow signal
3. Enter at the displayed Entry price
4. Book 50% profits at Target 1
5. Watch as price moves toward the Optimal Target-2 zone
6. Take remaining profits when price enters the highlighted optimal zone
Positional Approach (H4, D1):
1. Apply NEXUS to higher timeframes for swing trading
2. Take signals that align with the performance table trend (if 7-day and 30-day show UP, focus on BUY signals)
3. Enter at the Entry price and be patient
4. Book 30-40% at Target 1
5. Hold the remainder until price reaches the Optimal Target Zone
6. Exit when price enters the highlighted zone
Performance-Based Strategy:
- When all timeframe performance shows UP with strong percentages, trade more aggressively (take every signal, larger positions)
- When recent performance (1-day, 7-day) is mixed or DN, trade conservatively (skip signals, smaller positions)
- Use the performance table as a real-time market powered by MT4 Data Feed condition indicator
Customization & Flexibility
Visual Preferences:
- Toggle between Light and Dark themes instantly
- Enable/disable color-coded candles based on your analysis style
- Hide the dashboard for clean chart presentation when needed
Dashboard Control:
- Full view shows all information
- Collapsed view (via Hide button) shows only the NEXUS label
- Position the dashboard in any chart corner via settings
Alert Options:
- Configure popup, sound, and mobile push notifications
- Get alerted for new signals and target hits
- Customize alert messages and sound files
Technical Specifications
- Platform: MetaTrader 4 (MT4)
- Trading Styles: Both intraday and positional trading
- Timeframes: All (M1, M5, M15, M30, H1, H4, D1, W1)
- Instruments: All (Stocks, Indices, Forex, Commodities, Cryptocurrencies)
- Signal Components: Entry, Target 1, Optimal Target-2 with Zone
- Unique Features: Optimal Target Zone highlighting, Multi-timeframe performance tracking, Max Points/Max % monitoring
- Visual Controls: Hide/Show dashboard, Light/Dark theme, Cndl ON/OFF
- Performance Metrics: 1-day, 7-day, 30-day, 90-day tracking
- Alert Types: Popup, Sound, Mobile Push
- Dashboard: Collapsible, movable, real-time updates
- Repainting: No (all signals are final and permanent)
Trade Smarter with Optimal Zones
NEXUS transforms the way you approach profit targets. Instead of rigid price levels, you get intelligent optimal zones backed by probability analysis and risk/reward optimization. Combined with comprehensive performance tracking and flexible visual controls, NEXUS gives you everything you need for confident, data-driven trading.
Stop guessing where to take profits. Let NEXUS show you the optimal zone - then trade with clarity and confidence.
========================================
FEATURE HIGHLIGHTS (Bullet Points)
========================================
- Optimal Target Zone System - Visual green/yellow highlighted zones showing ideal profit-taking areas
- Complete Trade Levels - Entry, Target 1, and Optimal Target-2 for every signal
- Performance Tracking Table - Real-time statistics for 1-day, 7-day, 30-day, and 90-day periods
- Live Trade Monitoring - Max Points and Max % reached since entry
- Collapsible Dashboard - Hide button to minimize dashboard for clean charts
- Light/Dark Theme Toggle - Switch chart background instantly
- Color Candles Toggle - Cndl ON/OFF for colored candle display control
- Status Indicator - Know when trades are Open, Target Hit, or Closed
- Multi-Timeframe Performance - See indicator performance across different timeframes
- Clear Signal Arrows - Green for BUY, red for SELL
- On-Chart Visual Zones - Highlighted optimal target areas directly on price chart
- Real-Time LTP - Live last traded price updating continuously
- License Tracking - Expiry countdown display
- Universal Compatibility - Works on all instruments and timeframes
- No Repainting - Signals are final and permanent
==============================
RECOMMENDED TRADING APPROACH
==============================
Basic Strategy:
1. Wait for a clear BUY or SELL arrow signal
2. Check the performance table - if recent periods (1-day, 7-day) show strong UP performance, confidence is high
3. Enter at the displayed Entry price
4. Book 50% at Target 1
5. Hold remaining 50% until price enters the Optimal Target Zone (highlighted area)
6. Take profits anywhere within the highlighted zone
Conservative Approach:
- Only take signals when the 1-day and 7-day performance both show UP direction
- Book 60-70% at Target 1
- Exit remaining position as soon as price touches the Optimal Zone
Aggressive Approach:
- Take all signals regardless of performance table
- Book 30-40% at Target 1
- Hold remainder through the entire Optimal Zone, exiting at the top edge
Performance-Based Filtering:
- Strong performance (all periods UP): Trade every signal with standard position size
- Mixed performance (some UP, some DN): Trade selectively, reduced position size
- Weak performance (multiple DN periods): Skip signals or trade demo until performance improves
========================================
OPTIMAL ZONE ADVANTAGES
========================================
- Visual Clarity - See exactly where to take profits (highlighted zone on chart)
- Flexibility - Exit anywhere in the zone, not forced to wait for exact price
- Probability-Based - Zone is calculated based on likelihood of achievement
- Reduced Stress - No anxiety about missing exact Target 2 by a few ticks
- Better Execution - Can scale out gradually within the zone
- Realistic Targets - Accounts for support/resistance and market structure.